Is Your Heart at Risk? How the TG/HDL Ratio Can Warn You Early
Is your cholesterol test missing hidden heart disease risk? Learn how the TG/HDL ratio, TyG index, and CHG index can detect insulin resistance and cardiovascular risk earlier than traditional lipid markers.
HEARTMETABOLISM
Dr. T.S. Didwal, M.D.(Internal Medicine)
6/3/202622 min read
The TG/HDL ratio is calculated by dividing fasting triglycerides by HDL cholesterol. It is a powerful marker of insulin resistance, metabolic syndrome, and cardiovascular risk. A high TG/HDL ratio is associated with small dense LDL particles, arterial damage, and a greater risk of heart attack and stroke, even when LDL cholesterol appears normal.
Key Takeaways: TG/HDL Ratio & Heart Risk
Standard cholesterol tests can miss early risk. You can have “normal” total cholesterol and LDL but still carry high cardiovascular risk if your triglycerides are high and HDL is low.
TG/HDL ratio = Triglycerides ÷ HDL. You can calculate it from a basic fasting lipid panel. No extra test needed.
Optimal is below 1.5; elevated is above 3.5. Ratios >3.5 are strongly linked to insulin resistance, small-dense LDL, and arterial stiffness — all drivers of heart attack and stroke.
It’s especially powerful in prediabetes. Research shows TG/HDL independently predicts arterial stiffness in prediabetes, while other markers like the TyG index did not.
2026 ACC/AHA guidelines expand focus beyond LDL. They now highlight triglyceride-rich particles and lifetime metabolic risk, aligning with what TG/HDL captures.
Insulin resistance is the root cause. High triglycerides + low HDL reflect cells not responding well to insulin, which accelerates plaque buildup.
Lifestyle changes move it fast. Reducing added sugar/alcohol, 150+ min/week aerobic exercise, weight loss of 5–10%, and Mediterranean-style eating can drop your ratio in 1–3 months.
It predicts risk after heart procedures too. Post-PCI patients with high TG/HDL have more recurrent heart events, signaling ongoing metabolic risk.
New indices like CHG and TyG add glucose. Because high blood sugar makes cholesterol more atherogenic, combining lipids + glucose gives an even clearer picture.
Ask for it at your next visit. Don’t just ask “Is my cholesterol normal?” Ask “What’s my TG/HDL ratio?” It could give you a years-long head start.
Why Standard Cholesterol Tests Aren't Enough
For decades, clinical medicine has relied on a handful of numbers to assess cardiovascular risk: total cholesterol, LDL ("bad") cholesterol, HDL ("good") cholesterol, and triglycerides — each measured in isolation. But this reductionist approach has a critical flaw: it treats interconnected metabolic systems as if they were independent.
Think of it this way. A weather forecast based only on temperature would miss crucial information about humidity, wind, and atmospheric pressure. Similarly, a single biomarker misses the complex metabolic interactions that drive atherosclerosis — the slow, silent buildup of arterial plaque that causes most heart attacks and strokes.
Research published in Cardiovascular Diabetology (Mo et al., 2025) demonstrates this gap clearly: composite metabolic indices that combine lipid and glucose parameters consistently outperform single biomarkers in predicting cardiovascular disease outcomes, including coronary artery disease, myocardial infarction, and stroke.
The core problem is that insulin resistance — the foundational metabolic disturbance underlying most cardiovascular disease — doesn't show up cleanly on a standard cholesterol panel. A person can have perfectly "normal" LDL while simultaneously harboring the dangerous metabolic pattern of high triglycerides, low HDL, and borderline blood sugar that dramatically elevates their real-world heart risk.
Key Point: Approximately 1 in 4 American adults has elevated LDL cholesterol, but insulin resistance — the metabolic root of much cardiovascular disease — is even more prevalent and routinely missed by standard testing.
The 2026 Cardiology Guidelines: A New Era in Lipid Assessment
In March 2026, the American College of Cardiology (ACC) and American Heart Association (AHA), alongside nine partnering organizations, released a landmark update: the 2026 Multisociety Guideline on the Management of Dyslipidemia — the first major revision since 2018.
This document, published simultaneously in JACC and Circulation, formally expands the cardiovascular risk assessment toolkit beyond LDL cholesterol. Key updates include:
Expanded biomarker use: The guidelines now formally recommend selective measurement of apolipoprotein B (apoB) and lipoprotein(a) [Lp(a)] to capture atherogenic risk that LDL-C alone misses.
Earlier treatment: An "earlier and lower for longer" strategy emphasizing lifetime risk reduction rather than waiting for established disease.
Triglyceride-rich remnant particles: The guideline explicitly acknowledges the cardiovascular risk posed by triglyceride-rich lipoproteins — the very particles captured by TG/HDL-based indices — beyond LDL alone.
Updated risk equations: Replacement of the older Pooled Cohort Equations with the AHA's newer PREVENT™ equations for more precise 10- and 30-year risk assessment.
While the 2026 guidelines do not yet formally incorporate the TG/HDL ratio or CHG index as standard clinical tools, the scientific rationale for their use aligns directly with the guideline's expanded metabolic framework. Leading researchers and clinicians are increasingly using these indices as practical adjuncts to standard lipid panels.
What Is the TG/HDL Ratio and Why Does It Matter?
The triglyceride-to-HDL cholesterol ratio (TG/HDL-C) is exactly what it sounds like: your fasting triglyceride level divided by your HDL cholesterol level. This deceptively simple calculation captures the balance between two opposing forces in your arterial health:
Triglycerides represent excess circulating fat, primarily from refined carbohydrates, sugar, and excess calorie intake. High triglycerides promote the formation of small, dense LDL particles — the most dangerous form of "bad" cholesterol — and fuel arterial plaque development.
HDL cholesterol performs reverse cholesterol transport: it removes excess cholesterol from arterial walls and shuttles it back to the liver for elimination. Think of it as your arteries' cleanup crew.
When triglycerides overwhelm HDL — producing a high ratio — your cleanup crew is outnumbered by the mess. Arterial damage accelerates.
What the Research Shows
A comprehensive 2023 review published in Diagnostics (Kosmas et al.) synthesized evidence establishing the TG/HDL-C ratio as a robust marker of metabolic syndrome, insulin resistance, and cardiovascular disease risk. Key findings:
A high TG/HDL-C ratio strongly predicts the presence of small, dense LDL particles — even when total LDL appears normal
The ratio serves as a reliable surrogate for insulin resistance, the metabolic root of type 2 diabetes and cardiovascular disease
Elevated ratios are consistently associated with hypertension, abdominal obesity, and coronary artery disease across diverse populations
A 2025 cross-sectional study from Zhengzhou University (Frontiers in Endocrinology, Li et al.), analysing data from a large community cohort, confirmed that the TG/HDL-C ratio independently identifies individuals at high cardiovascular risk — reflecting the balance between atherogenic and anti-atherogenic lipid fractions more accurately than either measurement alone.
TG/HDL Ratio and Arterial Stiffness: A Critical Finding
One of the most clinically significant recent findings comes from Di Marco et al. (2025), published in Diabetes Research and Clinical Practice. In a study of 377 individuals — spanning normal glucose tolerance, prediabetes, and newly diagnosed type 2 diabetes — researchers found that:
The TG/HDL-C ratio was independently associated with arterial stiffness (measured by pulse wave velocity and augmentation index) specifically in the prediabetes group
This association held even after adjusting for blood pressure, body mass index, and other confounders
Importantly, the TyG index — another popular insulin resistance marker — was not independently associated with arterial stiffness in the prediabetes group in this study
This matters enormously. Arterial stiffness is a direct physiological marker of vascular aging and cardiovascular risk. The finding suggests that in people with prediabetes — a condition affecting hundreds of millions globally — the TG/HDL ratio may be the most sensitive and specific marker for detecting early vascular damage.
💡 Clinical Insight: If you have prediabetes or borderline blood sugar, your TG/HDL ratio may be a more meaningful indicator of early cardiovascular risk than your HbA1c or standard lipid panel alone.
How to Calculate Your TG/HDL Ratio
You can calculate this yourself using results from a standard fasting lipid panel. No additional testing is required.
Formula:
TG/HDL Ratio = Fasting Triglycerides (mg/dL) ÷ HDL Cholesterol (mg/dL)
(If your lab reports in mmol/L, multiply the result by 2.3 to convert to the mg/dL-based reference range.)
Example Calculation
Lab Value Result Fasting Triglycerides 160 mg/dL HDL Cholesterol 38 mg/dL TG/HDL Ratio 160 ÷ 38 = 4.2
Interpreting Your TG/HDL Ratio
Below 1.5: Indicates excellent metabolic health and high insulin sensitivity.
1.5–2.0: Generally considered healthy and associated with low cardiovascular risk.
2.0–3.5: May suggest early insulin resistance or developing metabolic dysfunction.
3.5–5.0: Frequently associated with increased cardiovascular risk, insulin resistance, and a higher likelihood of small dense LDL particles.
Above 5.0: Suggests significant metabolic impairment and warrants further clinical evaluation and risk assessment.
Note: TG/HDL ratio is best interpreted alongside other cardiometabolic markers such as ApoB, fasting glucose, HbA1c, blood pressure, and waist circumference.
⚠️ Important: Optimal cutoffs may vary based on your ethnicity, age, and medical history. These ranges should always be interpreted by your healthcare provider in the context of your complete clinical picture.
The CHG Index: A New Composite Risk Marker
The Cholesterol, High-Density Lipoprotein, and Glucose (CHG) index is a newer composite marker that integrates three fundamental metabolic parameters into a single risk score.
How It's Calculated
CHG Index = ln [Total Cholesterol (mg/dL) × Fasting Blood Glucose (mg/dL) / 2 × HDL (mg/dL)]
This formula was developed and validated by Smith et al. (2025) and further examined by Mo et al. (2025) in a large cohort study published in Cardiovascular Diabetology.
Why the CHG Index Is Innovative
Unlike pure lipid ratios, the CHG index recognizes a critical physiological reality: elevated blood glucose doesn't simply add to cardiovascular risk — it multiplies it.
Here's the mechanism: When blood glucose is chronically elevated, glucose molecules attach to proteins and lipid particles in a process called glycation. Glycated LDL particles are:
More likely to penetrate and lodge in arterial walls
More resistant to clearance by the liver
More prone to oxidation, triggering inflammatory responses
More difficult for HDL to remove through reverse cholesterol transport
By incorporating fasting glucose alongside total cholesterol and HDL, the CHG index captures this dangerous synergy between dyslipidemia and dysglycemia — the combined metabolic environment that drives atherosclerosis.
Research Findings
The cohort study by Mo et al. (2025) in Cardiovascular Diabetology compared the CHG index directly against the established TyG index for predicting cardiovascular events. Key findings:
The CHG index demonstrated superior predictive value over the TyG index for coronary artery disease, myocardial infarction, and cerebrovascular events
The CHG index captured the interplay between lipid metabolism and glucose homeostasis more completely than single biomarkers
The index identified at-risk individuals who would have been missed by traditional cholesterol testing alone
Smith et al. (2025) validated the CHG index against major adverse cardiovascular events (MACE) and proposed specific cutoff values enabling low-, intermediate-, and high-risk stratification.
⚠️ Note: The Smith et al. (2025) publication is a preprint and awaits full peer review. The Mo et al. (2025) study is peer-reviewed and published. Clinical application of the CHG index is emerging, not yet standard of care.
💡 Clinical Insight: If you are managing both borderline blood sugar and suboptimal lipids, you cannot treat these as separate problems. Improving glucose control directly reduces the atherogenicity of your cholesterol particles.
The TyG Index: Your Insulin Resistance Radar
The Triglyceride-Glucose (TyG) index is calculated as:
TyG Index = ln [Fasting Triglycerides (mg/dL) × Fasting Glucose (mg/dL) / 2]
The TyG index is widely validated as a sensitive surrogate marker for insulin resistance — arguably the most reliable simple surrogate available without a complex insulin clamp study.
Why TyG Matters Even When HbA1c Looks Normal
HbA1c — the standard 3-month average blood sugar test — can appear completely normal in the early stages of insulin resistance. Your pancreas compensates by secreting extra insulin, keeping glucose values in range while the underlying resistance silently escalates.
The TyG index catches this compensatory phase. Research published in Frontiers in Endocrinology (He et al., 2025) demonstrated that the HDL-modified TyG index — an enhanced version incorporating HDL — showed robust associations with both all-cause and cardiovascular mortality in patients with acute decompensated heart failure, beyond what traditional risk factors could predict.
For heart failure specialists, this modified index provides prognostic information from routine laboratory tests, enabling identification of patients who need intensified monitoring and more aggressive lipid-lowering or glycemic management.
💡 Think of the TyG index as your metabolic engine warning light — it catches "engine trouble" years before a Type 2 diabetes diagnosis. A high TyG suggests your body is working hard behind the scenes to maintain normal blood sugar, and that extra work is harming your arteries.
Quick Summary:
TG/HDL > 3.5 = Insulin resistance + high CV risk
CHG index predicts early atherosclerosis
TyG index = early signal for prediabetes
HDL-modified TyG predicts mortality in HF
Composite indices outperform single cholesterol values
The Science Behind These Markers: Insulin Resistance and Atherosclerosis
All three indices — TG/HDL, CHG, and TyG — share a common scientific foundation: insulin resistance is the central metabolic disturbance driving cardiovascular disease.
Understanding this mechanism helps explain why composite markers outperform single biomarkers.
The Insulin Resistance Cascade
When cells stop responding normally to insulin, a predictable metabolic cascade follows:
Step 1 — Triglyceride overproduction: The liver, receiving incomplete signals from insulin, ramps up VLDL (very-low-density lipoprotein) production, releasing excess triglycerides into circulation.
Step 2 — HDL depletion: As triglyceride-rich VLDL particles circulate, they exchange triglycerides for cholesterol esters with HDL particles — a process that destabilizes and degrades HDL. The result: lower HDL levels and higher TG/HDL ratios.
Step 3 — Small, dense LDL formation: Triglyceride-enriched LDL particles are processed into small, dense LDL (sdLDL) — smaller, more numerous, and more dangerous than standard LDL. They penetrate arterial walls more easily, resist clearance, and oxidize more readily. Critically, sdLDL may not be captured accurately by standard LDL-C measurements.
Step 4 — Glucose dysregulation: Rising insulin resistance impairs glucose uptake in muscle and fat cells, gradually elevating fasting glucose. Elevated glucose drives protein glycation, further damaging blood vessel walls and making LDL particles stickier.
Step 5 — Endothelial dysfunction and inflammation: All of the above promote chronic low-grade inflammation and impair the endothelium — the single-cell lining of your arteries — reducing its ability to regulate vascular tone, clotting, and plaque stability.
Step 6 — Atherosclerosis acceleration: With the arterial environment primed by dyslipidemia, glycation, inflammation, and endothelial dysfunction, atherosclerotic plaques develop and grow. The culmination: plaque rupture triggering a blood clot — a heart attack or stroke. This cascade explains why composite indices that capture multiple aspects of this process simultaneously are more predictive than any single measurement.
TG/HDL in Special Populations
After Heart Procedures: Predicting Long-Term Outcomes
Zhou et al. (2024), published in Scientific Reports, examined acute coronary syndrome (ACS) patients who underwent percutaneous coronary intervention (PCI) — the stent procedure used to open blocked arteries. The critical question: who remains at highest risk after the procedure?
The TG/HDL ratio was a significant independent predictor of major adverse cardiovascular events (MACE) after PCI, even accounting for traditional risk factors. Patients with elevated ratios experienced more recurrent heart attacks, repeat procedures, and cardiovascular deaths.
The clinical message: fixing the plumbing isn't enough. The metabolic environment that created the blockage remains unless actively addressed. A high post-PCI TG/HDL ratio signals ongoing atherogenic activity — and the need for aggressive secondary prevention including high-intensity statins, lifestyle modification, and potentially PCSK9 inhibitors.
Heart Failure Patients: A Mortality Signal
He et al. (2025), published in Frontiers in Endocrinology, demonstrated that the HDL-cholesterol-modified TyG index independently predicted both all-cause and cardiovascular mortality in acute decompensated heart failure (ADHF) patients.
In heart failure, metabolic health directly translates to cardiac function. The heart muscle requires clean, efficient fuel. When insulin resistance impairs glucose uptake and HDL dysfunction reduces cholesterol clearance, the already-stressed heart muscle is further compromised.
Sepsis: An Emerging Application
A 2026 retrospective cohort study (Şahin et al., Diagnostics, 2026) examined 600 adult ICU patients with sepsis over five years. The study found that both the TG/HDL-C ratio and the TyG index — combined with inflammatory biomarkers including the neutrophil-to-lymphocyte ratio (NLR) and systemic immune-inflammation index (SII) — improved short-term mortality prediction beyond conventional clinical scoring systems alone.
This finding extends the utility of metabolic indices beyond cardiovascular disease into critical care medicine, reflecting how broadly metabolic health influences systemic outcomes.
Prediabetes: The Clearest Case for Early Screening
As discussed, Di Marco et al. (2025) showed that in 377 individuals across glucose tolerance categories, the TG/HDL ratio was the superior marker for detecting early arterial stiffness, specifically in prediabetes. This is arguably the most clinically actionable finding: prediabetes affects hundreds of millions globally, is largely reversible, and is a window of opportunity to prevent both diabetes and cardiovascular disease — but only if risk is detected early enough to act on.
Study Evidence Summary Table
CHG Index (Cholesterol-Heart-Glucose) Studies
Mo et al. (2025, Cardiovascular Diabetology): Studied a general cohort and found that the CHG index is superior to the TyG index for predicting coronary artery disease (CAD), myocardial infarction (MI), and stroke.
Smith et al. (2025, medRxiv preprint): Evaluated a general population sample and confirmed the CHG index predicts Major Adverse Cardiovascular Events (MACE), proposing specific clinical cutoffs for patient risk stratification.
TG/HDL-C Ratio Studies
Kosmas et al. (2023, Diagnostics): Conducted a general review concluding that the TG/HDL-C ratio serves as a strong predictor of metabolic syndrome and overall cardiovascular risk.
Di Marco et al. (2025, Diabetes Res Clin Pract): Focused on 377 patients with prediabetes and discovered that the TG/HDL ratio is independently associated with arterial stiffness, outperforming the TyG index in this specific group.
Zhou et al. (2024, Scientific Reports): Tracked Acute Coronary Syndrome (ACS) patients post-PCI (angioplasty) and found the ratio successfully predicts MACE after coronary intervention.
Li et al. (2025, Frontiers in Endocrinology) looked at a high-risk cardiovascular cohort and proved that the ratio independently identifies high cardiovascular risk even after accounting for standard lipid panels.
TyG Index Variations & Combined Indices
He et al. (2025, Frontiers in Endocrinology): Investigated heart failure patients using an HDL-modified TyG index, finding that it accurately predicts all-cause and cardiovascular mortality in cases of Acute Decompensated Heart Failure (ADHF).
Şahin et al. (2026, Diagnostics): Analyzed 600 ICU sepsis patients and found that combining TG/HDL, TyG, and inflammatory markers significantly improves the prediction of mortality in critical care settings.
Common Myths and Mistakes
Myth 1: "My total cholesterol is normal, so I'm fine." This is the most dangerous misconception in cardiovascular medicine. Total cholesterol can be perfectly normal while you carry a TG/HDL ratio above 4.0 — a metabolic signature strongly associated with insulin resistance and accelerated atherosclerosis. Normal total cholesterol does not rule out significant cardiovascular risk.
Myth 2: "High triglycerides are just a diet problem — a few days of clean eating will fix it." While acute dietary changes (especially alcohol or refined carbohydrate consumption) do transiently elevate triglycerides, chronically high triglycerides reflect deep metabolic dysfunction. They require sustained lifestyle changes or medication, not short-term dietary corrections before a blood draw.
Myth 3: "These are exotic tests my doctor has to order specially." No special testing is required. The TG/HDL ratio is calculated from the standard fasting lipid panel your doctor already orders. The CHG and TyG indices additionally require fasting glucose, also a standard test. The calculations take less than a minute.
Myth 4: "I need medication — lifestyle changes won't move these numbers." The evidence is clear: even modest improvements in diet, exercise habits, and body weight produce meaningful improvements in triglycerides, HDL, and fasting glucose — the inputs to all these indices. In many people, comprehensive lifestyle change achieves more dramatic improvements than medication alone.
Myth 5: "These markers only matter if I'm diabetic or overweight." Research shows that elevated TG/HDL ratios and high TyG indices occur across body weight categories, including in individuals of normal weight with underlying insulin resistance — a condition sometimes called "metabolically unhealthy normal weight" or TOFI (Thin Outside, Fat Inside).
Mistake: Using a non-fasting sample. Triglycerides are highly sensitive to recent food intake — particularly carbohydrates and fat. For accurate TG/HDL and TyG calculations, blood must be drawn after a minimum 8–12 hours of fasting. Non-fasting triglyceride values will produce misleading ratios.
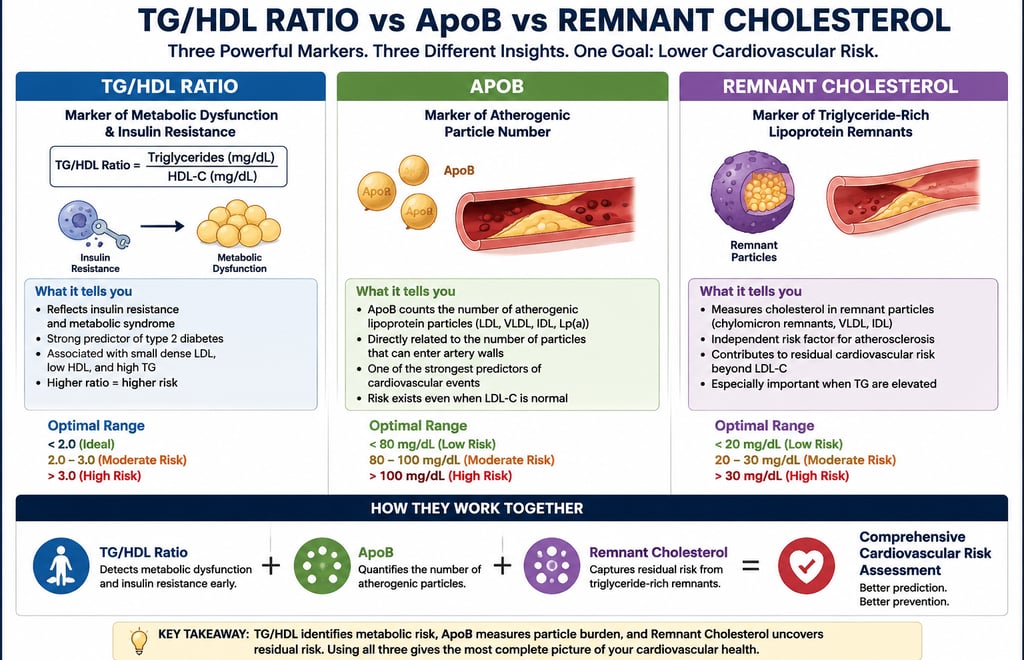
TG/HDL vs ApoB vs Remnant Cholesterol
While the TG/HDL ratio is an excellent marker of insulin resistance and metabolic dysfunction, ApoB directly measures the number of atherogenic lipoprotein particles that can enter artery walls, making it one of the strongest predictors of cardiovascular risk. Remnant cholesterol reflects cholesterol carried in triglyceride-rich lipoproteins and is increasingly recognized as an independent contributor to atherosclerosis. Together, these markers provide complementary information: TG/HDL identifies metabolic risk, ApoB quantifies particle burden, and remnant cholesterol captures residual risk beyond LDL cholesterol. Using all three offers a more complete assessment of cardiovascular health than any single marker alone.
How to Improve Your TG/HDL Ratio: Evidence-Based Strategies
The good news: all three composite indices — TG/HDL, CHG, and TyG — respond to the same underlying metabolic improvements. Targeting insulin sensitivity and lipid balance moves all of them in the right direction simultaneously.
Dietary Strategies
Reduce refined carbohydrates and added sugars. This is the single most impactful dietary change for lowering triglycerides. White bread, sugary beverages, fruit juices, pastries, and processed snacks cause rapid spikes in glucose and triglycerides. Studies show that reducing sugar intake can lower triglycerides by 20–50% in sensitive individuals.
Adopt a Mediterranean or low-glycemic eating pattern. Both the Mediterranean diet and low-glycemic dietary approaches consistently improve TG/HDL ratios in randomized controlled trials. Key elements: olive oil, fatty fish (salmon, sardines, mackerel), nuts, legumes, abundant vegetables, and whole grains in moderate amounts.
Increase omega-3 fatty acids. High-dose prescription omega-3 formulations (icosapentaenoic acid/EPA) reduce triglycerides by 20–30% in hypertriglyceridemia. Dietary sources include fatty fish, flaxseed, and walnuts.
Limit alcohol. Alcohol is a potent triglyceride-raising agent. Even moderate consumption (1–2 drinks daily) can significantly elevate triglycerides in susceptible individuals.
Increase dietary fiber. Soluble fiber from oats, legumes, psyllium, and vegetables improves insulin sensitivity, lowers LDL, and modestly raises HDL over time.
Physical Activity
Aerobic exercise is the most powerful non-pharmacological intervention for triglyceride reduction. A minimum of 150 minutes per week of moderate-intensity aerobic activity (brisk walking, cycling, swimming) consistently lowers triglycerides and raises HDL. Studies show that a single session of aerobic exercise can reduce triglycerides for 24–72 hours.
Resistance training improves insulin sensitivity independently of weight loss. Building lean muscle mass increases the amount of tissue available to absorb blood glucose, directly addressing the root cause of elevated TG/HDL ratios. Aim for 2–3 strength training sessions per week targeting major muscle groups.
Reduce sedentary time. Even breaking up prolonged sitting with short activity breaks (standing, light walking) improves postprandial triglyceride clearance and glucose disposal.
Weight Management
Even modest weight loss — 5 to 10% of body weight — produces substantial improvements in triglycerides, HDL, and fasting glucose. In individuals with overweight or obesity and metabolic syndrome, weight loss is among the most powerful interventions for normalizing composite cardiovascular risk indices.
Sleep and Stress
Chronic sleep deprivation (under 6 hours per night) worsens insulin sensitivity and raises triglycerides. Similarly, chronic psychological stress elevates cortisol, which promotes fat storage and glucose dysregulation. Addressing both is an underappreciated but evidence-supported component of metabolic risk management.
Medication Options
When lifestyle changes are insufficient, physicians have several evidence-based options:
Here is the breakdown of the medication classes organized into clear, scannable bullet points optimized for quick clinical reference:
First-Line Lipid Lowering & Heart Protection
Statins:
Primary Effect: Lowers LDL cholesterol, provides modest triglyceride (TG) reductions, and raises HDL slightly.
Best For: Most patients presenting with elevated cardiovascular (CV) risk.
PCSK9 Inhibitors:
Primary Effect: Dramatically lowers LDL cholesterol levels.
Best For: Very high-risk patients and those with familial hypercholesterolemia (genetically high cholesterol).
Targeted Triglyceride Management
Fibrates:
Primary Effect: Reduces triglycerides by 30% to 50% and raises HDL.
Best For: Isolated hypertriglyceridemia (severely elevated triglycerides alone).
Omega-3 Fatty Acids (Prescription-Grade):
Primary Effect: Reduces triglycerides by 20% to 30%.
Best For: Patients with severe hypertriglyceridemia (TG greater than 500 mg/dL) or those with residual cardiovascular risk while already on standard statin therapy.
Metabolic & Weight Management (With Cardiovascular Benefits)
GLP-1 Receptor Agonists:
Primary Effect: Drives significant weight loss, improves glucose control, and lowers triglycerides.
Best For: Patients managing obesity or type 2 diabetes.
SGLT2 Inhibitors:
Primary Effect: Lowers glucose levels, provides modest triglyceride reductions, and supports weight loss.
Best For: Patients with type 2 diabetes who also have concurrent cardiovascular or renal (kidney) disease.⚠️ Medication decisions should always be made in consultation with a qualified healthcare provider based on your individual risk profile, comorbidities, and complete clinical picture.
Frequently Asked Questions
What is a healthy TG/HDL ratio?
A TG/HDL ratio below 2.0 is generally considered healthy, with values below 1.5 considered optimal. Ratios above 3.5 are associated with significantly increased metabolic and cardiovascular risk, and values above 5.0 warrant urgent clinical evaluation. Specific targets may vary by ethnicity, sex, and individual health status — South Asian and East Asian populations, for example, may have metabolic risk at lower absolute values.
Can I have a high TG/HDL ratio with normal cholesterol?
Yes — and this is precisely the clinical gap that makes composite indices so valuable. You can have perfectly normal total cholesterol and LDL-C while harboring a high TG/HDL ratio driven by low HDL and elevated triglycerides. This metabolic pattern reflects insulin resistance and significantly increases cardiovascular risk despite "normal" traditional markers.
How often should I check these markers?
For average-risk individuals, a fasting lipid panel and fasting glucose every 3–5 years is typically adequate. If you have metabolic syndrome, prediabetes, cardiovascular disease, or an elevated TG/HDL ratio, annual or even more frequent monitoring may be appropriate. Your doctor can guide frequency based on your personal risk profile.
Is the CHG index available as a standard clinical test?
Not yet as a standardized ordered test, but all the inputs — total cholesterol, HDL, and fasting glucose — are components of routine blood work. You or your doctor can calculate the CHG index manually once those values are available.
Does the TG/HDL ratio apply to people on statin therapy?
Yes. Statins primarily target LDL cholesterol and have modest effects on triglycerides and HDL. Patients on statin therapy may still carry elevated TG/HDL ratios reflecting residual metabolic risk — sometimes called "residual cardiovascular risk." This is one reason why researchers are increasingly looking beyond LDL-C as the sole target of therapy.
Can children or adolescents have abnormal TG/HDL ratios?
Yes. Rates of metabolic syndrome and insulin resistance in children and adolescents have risen substantially alongside obesity rates. The 2026 ACC/AHA guidelines explicitly recommend earlier lipid evaluation and health behaviour counselling in young people with risk factors. Research on TG/HDL ratio cutoffs specific to pediatric populations is ongoing.
What's the difference between the TG/HDL ratio and the TyG index?
The TG/HDL ratio divides triglycerides by HDL and reflects the balance between atherogenic and anti-atherogenic lipid fractions. The TyG index combines triglycerides and fasting glucose (without HDL) and is specifically validated as a surrogate for insulin resistance. Both capture overlapping but not identical metabolic information. The 2025 Di Marco study found TG/HDL superior for detecting arterial stiffness in prediabetes, while TyG may be more sensitive in other contexts. Using both together provides a more complete metabolic picture.
Are these ratios affected by medications other than lipid-lowering drugs?
Yes. Corticosteroids, certain antipsychotics, beta-blockers, thiazide diuretics, oral contraceptives, and HIV antiretrovirals can all affect triglycerides, HDL, or glucose — and thus affect these indices. Always inform your doctor of all medications when interpreting metabolic lab results.
If I improve my diet, how quickly will my TG/HDL ratio improve?
Triglycerides respond relatively quickly — significant dietary changes can lower triglycerides within 4–8 weeks. HDL responds more slowly to lifestyle interventions, often requiring 3–6 months of sustained exercise and dietary change to show meaningful improvement. Full metabolic normalization after significant lifestyle changes typically takes 3–12 months.
Are there ethnic differences in TG/HDL ratio interpretation?
Emerging evidence suggests that optimal cutoffs may differ across ethnic groups. South Asian individuals, for instance, tend to have higher metabolic risk at lower absolute triglyceride levels. The 2026 ACC/AHA guidelines acknowledge that risk equations and biomarker thresholds need refinement across diverse populations. Discuss your specific background with your healthcare provider for individualized interpretation.
Clinical pearls
1. TG/HDL Ratio
Don't look at triglycerides or HDL in isolation. Think of triglycerides as the "trash" (excess fat) and HDL as the "clean-up crew." Dividing your triglycerides by your HDL gives you a ratio that tells you if your clean-up crew is overwhelmed. In 2026, we know that a ratio above 3.5 is a loud alarm for insulin resistance and heart risk.
Clinical Insight: A "normal" total cholesterol can hide a dangerous TG/HDL ratio. If your ratio is high, your arteries are likely accumulating "trash" faster than they can be cleaned.
2. CHG Index
The new CHG Index (Cholesterol, HDL, Glucose) is a game-changer because it recognizes that high sugar and high fat don't just add up—they multiply each other's damage. When glucose is high, it "syrup-coats" your cholesterol particles, making them stickier and more likely to lodge in your artery walls.
Clinical Insight: If you are managing both borderline blood sugar and high cholesterol, you cannot treat them as separate issues. Improving your glucose will directly make your cholesterol profile less dangerous.
3. TyG Index
The Triglyceride-Glucose (TyG) Index is your most sensitive radar for insulin resistance. Even if your "A1c" (3-month average sugar) looks okay, a high TyG index indicates that your body is struggling behind the scenes to keep those numbers stable.
Clinical Insight: Think of the TyG index as an early warning system. It often catches metabolic "engine trouble" years before a diagnosis of Type 2 Diabetes occurs.
4. Secondary Prevention
If you’ve already had a heart procedure (like a stent or PCI), your TG/HDL ratio is your best predictor of future success. The 2024–2025 data (Zhou et al.) show that even if the "plumbing" is fixed, a high metabolic ratio means the "soil" is still fertile for growing new blockages.
Clinical Insight: After a heart procedure, your goal isn't just "clear pipes"; it’s a metabolic reset. Lowering your ratio through diet and exercise is what keeps that stent open long-term.
5. The Modified TyG
For those dealing with heart failure, the HDL-modified TyG index is a critical survival marker. It measures how well your body uses fuel (glucose) and filters out waste (HDL). When this index is off, it signals that the heart muscle isn't getting the "clean energy" it needs to pump effectively.
Clinical Insight: In high-risk cardiac patients, metabolic health is synonymous with heart strength. Improving these numbers can literally take the physical load off a weakened heart muscle.
Conclusion and Action Steps
The science is unambiguous: your TG/HDL ratio, CHG index, and TyG index tell a story about your cardiovascular health that standard cholesterol testing often cannot. These composite markers capture the metabolic reality of insulin resistance — the hidden root cause behind most heart attacks and strokes — before it progresses to diagnosable diabetes or symptomatic heart disease.
The 2026 ACC/AHA Dyslipidemia Guidelines mark a pivotal shift in how cardiology approaches lipid risk, formally expanding beyond LDL to embrace a broader metabolic picture. The TG/HDL ratio and related indices represent the practical, accessible leading edge of this evolution.
Your Action Plan
Step 1: At your next blood draw, ask for a fasting lipid panel and fasting glucose if not already included. These are standard tests covered by most insurance plans.
Step 2: Calculate your TG/HDL ratio (triglycerides ÷ HDL). If the result is above 3.5, discuss it with your healthcare provider in the context of your overall cardiovascular risk.
Step 3: If your ratio is elevated, take meaningful action: reduce refined carbohydrates and sugars, prioritize aerobic exercise (at least 150 minutes per week), and if overweight, aim for modest but sustained weight loss.
Step 4: Recheck in 3–6 months. These markers respond to lifestyle change — tracking your progress is motivating and clinically meaningful.
Step 5: Ask your doctor about the CHG index and TyG index. Bring this article if helpful. You are the most important advocate for your own cardiovascular health.
The bottom line: Heart disease doesn't start the day you have a heart attack. It starts years earlier, in a metabolic environment your standard cholesterol test may not see — but your TG/HDL ratio can.
Disclaimer: This article is for informational purposes only and does not constitute medical advice. Individual circumstances vary, and treatment decisions should always be made in consultation with qualified healthcare professionals.
Related Articles
Reversing Heart Age: What New Research Reveals About Arterial Stiffness | DR T S DIDWAL
Forget BMI: Metabolic Health Is the Real Key to Heart Disease Risk | DR T S DIDWAL
High Blood Pressure? Why the TyG Index Is a Powerful Hidden Marker of Metabolic Risk | DR T S DIDWAL
hsCRP Explained: What Inflammation Means for Your Heart | DR T S DIDWAL
What’s New in the 2025 Blood Pressure Guidelines? A Complete Scientific Breakdown | DR T S DIDWAL
Low-Fat vs. Low-Carb: Which Diet is Best for Weight Loss? | DR T S DIDWAL
5 Steps to Reverse Metabolic Syndrome: Diet, Habit, & Lifestyle Plan | DR T S DIDWAL
The Role of Cholesterol in Health and Disease: Beyond the "Bad" Label | DR T S DIDWAL
Lowering Cholesterol with Food: 4 Phases of Dietary Dyslipidemia Treatment | DR T S DIDWAL
The Best Dietary Fat Balance for Insulin Sensitivity, Inflammation, and Longevity | DR T S DIDWAL
References
Mo, D., Zhang, P., Zhang, M., Xie, J., Wang, X., Li, Y., Chen, H., & Liu, X. (2025). Cholesterol, high-density lipoprotein, and glucose index versus triglyceride–glucose index in predicting cardiovascular disease risk: A cohort study. Cardiovascular Diabetology, 24, 116. https://doi.org/10.1186/s12933-025-02675-y
Kosmas, C. E., Rodriguez Polanco, S., Bousvarou, M. D., Papakonstantinou, E. J., Peña Genao, E., Guzman, E., & Kostara, C. E. (2023). The triglyceride/high-density lipoprotein cholesterol (TG/HDL-C) ratio as a risk marker for metabolic syndrome and cardiovascular disease. Diagnostics, 13(5), 929. https://doi.org/10.3390/diagnostics13050929
Di Marco, M., Scilletta, S., Miano, N., Capuccio, S., Musmeci, M., Di Mauro, S., Filippello, A., Scamporrino, A., Bosco, G., Di Giacomo Barbagallo, F., Scicali, R., Piro, S., Purrello, F., Wagner, R., & Di Pino, A. (2025). Triglycerides to high density lipoprotein cholesterol ratio (TG/HDL), but not triglycerides and glucose product (TyG) index, is associated with arterial stiffness in prediabetes. Diabetes Research and Clinical Practice, 224, 112189. https://doi.org/10.1016/j.diabres.2025.112189
He, S., Xie, L., Xie, G., Jian, G., Jiang, K., Lu, Z., Zhang, S., Wang, Q., Lu, H., Xiong, Z., Wu, Z., Sheng, G., Lai, H., Wang, W., & Zou, Y. (2025). Independent and combined associations of high-density lipoprotein cholesterol-modified triglyceride-glucose index with all-cause and cardiovascular mortality in patients with acute decompensated heart failure. Frontiers in Endocrinology, 16, Article 1629066. https://doi.org/10.3389/fendo.2025.1629066
Zhou, S., Qiu, M., Wang, K., Liu, Y., Zhang, L., Chen, R., Wu, J., & Yang, H. (2024). Triglyceride to high density lipoprotein cholesterol ratio and major adverse cardiovascular events in ACS patients undergoing PCI. Scientific Reports, 14, 31752. https://doi.org/10.1038/s41598-024-82064-9
Şahin, N., Aydemir, S., Selmi, N. H., Ertaş, İ., Gökçe, Y. K., Döğer, C., Terzi, G., & Ensarioğlu, M. (2026). Association of triglyceride-to-HDL-C ratio, triglyceride–glucose index, and inflammatory biomarkers with mortality in intensive care unit patients with sepsis. Diagnostics, 16(6), 844. https://doi.org/10.3390/diagnostics16060844
Smith, J. A., Lee, Q., Patel, R. K., & Gupta, M. (2025). A novel composite index for cardiovascular risk: The cholesterol, high-density lipoprotein, glucose (CHG) index (Version 1) [Preprint]. medRxiv. https://doi.org/10.1101/2025.04.02.25325143v1
Li, P., Cai, J., Yuan, S., Li, Y., Shi, H., Liang, C., He, B., Xie, Q., Lei, B., Bai, J., Wang, N., Liu, D., Wang, Q., Xiong, J., Wang, J., & Wang, H. (2025). The relationship between triglyceride to high-density lipoprotein cholesterol ratio and cardiovascular high risk: a cross-sectional investigation. Frontiers in Endocrinology, 16. https://doi.org/10.3389/fendo.2025.1688624
American College of Cardiology/American Heart Association Joint Committee on Clinical Practice Guidelines. (2026). 2026 ACC/AHA/AACVPR/ABC/ACPM/ADA/AGS/APhA/ASPC/NLA/PCNA Guideline on the Management of Dyslipidemia. Circulation. https://doi.org/10.1161/CIR.0000000000001423
Blumenthal, R. S., Morris, P. B., et al. (2026). 2026 Dyslipidemia Guideline-at-a-Glance. Journal of the American College of Cardiology. https://doi.org/10.1016/j.jacc.2026.02.4872
Akar, G., Sengul-Bag, F., Akyurek, F., & Ozturk, B. (2026). Investigation of the relationship between trimethylamine N-oxide, CD36, and CD38 levels in individuals with a high triglyceride/HDL-cholesterol ratio. Scandinavian Journal of Clinical and Laboratory Investigation, 86(1), 42–52. https://doi.org/10.1080/00365513.2026.2616760
Mehta, A., & Shapiro, M. D. (2022). Apolipoproteins in vascular biology and atherosclerotic disease. Nature Reviews Cardiology, 19, 168–179. https://doi.org/10.1038/s41569-021-00613-5
Article by Dr. T.S. Didwal, M.D. (Internal Medicine). Last reviewed and updated: June 2026.