Body Roundness Index vs. BMI: Which Better Predicts Diabetes and Heart Disease
Is BMI missing hidden health risks? Discover how the Body Roundness Index (BRI) predicts visceral fat, diabetes, fatty liver, and heart disease more accurately than BM
OBESITY
Dr. T.S. Didwal, M.D.(Internal Medicine)
6/29/202623 min read
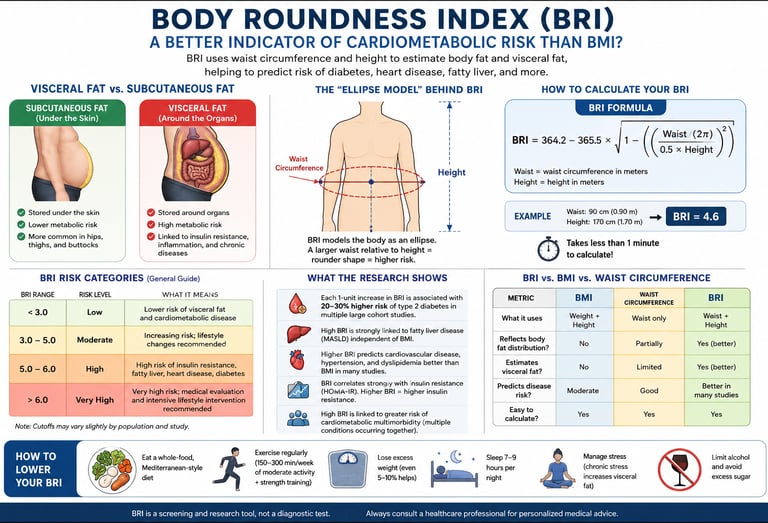
The Body Roundness Index (BRI) is a body-fat assessment tool that estimates visceral fat and cardiometabolic risk using waist circumference and height. Unlike Body Mass Index (BMI), BRI reflects where fat is stored, making it a better predictor of type 2 diabetes, fatty liver disease, insulin resistance, cardiovascular disease, and metabolic syndrome in many studies. BRI is intended as a screening tool and should be interpreted alongside blood tests and other clinical risk factors.
Key Points
The Geometric Core Reality: Unlike the traditional Body Mass Index (BMI)—which flattens the human body into a uniform box model—the Body Roundness Index (BRI) applies an advanced geometric ellipse equation. By pairing height directly with waist circumference, it mathematically maps individual body eccentricity to accurately capture structural fat distribution.
Exposing the "TOFI" Blind Spot: BMI possesses a dangerous clinical blind spot: it frequently misclassifies individuals carrying low lean mass and high abdominal fat as "healthy." BRI systematically solves this by identifying "Thin Outside, Fat Inside" (TOFI) phenotypes, ensuring high-risk visceral fat accumulation does not go unnoticed behind a seemingly normal weight.
The Visceral Fat Axis: BRI serves as a reliable, zero-cost anthropometric proxy for Visceral Adipose Tissue (VAT). Unlike passive subcutaneous fat under the skin, visceral fat is a highly destructive, endocrinologically active tissue that constantly floods the portal vein with free fatty acids and inflammatory cytokines.
Predicting Disease Stacking (Multimorbidity): Long-term data from massive multi-year cohorts reveal that BRI's true clinical value lies in predicting cardiometabolic multimorbidity—the clustering of multiple conditions like type 2 diabetes, fatty liver (MASLD), and heart disease. Individuals in the highest BRI quartile face a nearly threefold higher risk of developing multiple conditions simultaneously.
A Clear Window for Early Intervention: Long-term tracking shows that BRI's predictive power is strongest when transitioning from a completely healthy state to a first metabolic diagnosis. This makes it an ideal early-warning metric, allowing clinicians and individuals to intercept metabolic decline long before chronic symptoms emerge.
The Mechanistic Thread to Insulin Resistance: Higher BRI scores track closely with elevated HOMA-IR values. The inflammation and lipotoxicity driven by high abdominal roundness physically disrupt insulin receptor signaling, creating a direct bridge between structural shape and cellular insulin resistance.
Moving Past Rigid Single Cutoffs: Because body composition and fat distribution vary naturally across different ages, sexes, and ethnicities, there is no single universal "pass/fail" BRI number. Instead, it is best utilized as a continuous, dynamic risk gradient and personal trend-line to monitor over time.
High Visual Responsiveness to Change: While stubborn subcutaneous fat is often slow to move, visceral fat layers are highly metabolically responsive. Structured aerobic exercise, progressive resistance training, and reducing refined carbohydrates can rapidly reduce waist circumference—delivering measurable drops in a person's BRI score and dramatically lowering their metabolic risk profile.
If a doctor told you that your Body Mass Index (BMI) was "normal," you'd probably feel relieved. But BMI has a well-known blind spot: it can't tell the difference between a muscular 200-pound athlete and a 200-pound person carrying most of that weight around their waist. It also can't see where your fat lives — and where it lives matters enormously for your heart, your liver, and your long-term metabolic health.
That's the gap the Body Roundness Index (BRI) was built to close.
BRI is a relatively new anthropometric measurement — meaning it's calculated from body measurements rather than a blood test — that estimates how much of your body is made up of visceral fat (the metabolically active fat packed around your internal organs) relative to your overall size. Unlike BMI, which only needs your height and weight, BRI uses your waist circumference and height together, modeling your body as a geometric ellipse rather than treating everyone like a uniform box.
Since it was introduced by researcher Diana Thomas and colleagues in 2013, BRI has been tested against dozens of health outcomes — and the picture that's emerged from population studies across China, Korea, Japan, the US, and beyond is consistent: higher BRI tracks with higher rates of insulin resistance, type 2 diabetes, fatty liver disease, cardiovascular disease, and — when multiple of these conditions stack up together — what researchers call cardiometabolic multimorbidity.
A note on scope: BRI is a research and screening tool, not a diagnostic test. This article synthesizes findings from peer-reviewed cohort studies, but no anthropometric index replaces an evaluation by your physician. If you have concerns about your cardiometabolic risk, talk to a doctor — ideally with actual labs (lipid panel, fasting glucose, insulin) in hand.
1. What Is the Body Roundness Index (BRI)?
The Body Roundness Index is a formula-based estimate of body shape, designed to approximate two things that are otherwise hard to measure without a scan: your total body fat percentage and your visceral adipose tissue (VAT). This fat wraps around your liver, pancreas, and intestines.
Visceral fat is not just inert storage. It's biologically active tissue that releases inflammatory signaling molecules (cytokines like TNF-alpha and IL-6), free fatty acids, and hormones that interfere with how your cells respond to insulin. This is the mechanistic thread connecting visceral fat to almost every condition discussed in this article.
BRI was developed using dual-energy X-ray absorptiometry (DXA) data to validate the formula against actual measured body fat and visceral fat volume, which is part of why it has held up reasonably well across many independent populations since its introduction It models the human body as an ellipse, using its eccentricity to estimate visceral and total body fat percentages, and is calculated from height and waist circumference, providing a more comprehensive assessment of visceral fat than BMI.
Why Waist-and-Height-Based Measures Matter
Two people with identical height and weight can have completely different fat distributions. One might carry fat in the hips and thighs (a pattern generally considered lower-risk). In contrast, the other carries it centrally, around the abdomen (a pattern strongly linked to insulin resistance and cardiovascular disease). BMI cannot distinguish between them. BRI, because it incorporates waist circumference, captures this difference far better.
2. How to Calculate Your BRI
BRI is calculated from two simple body measurements—your height and waist circumference. The formula estimates how much fat is stored around your abdomen, providing a better picture of central obesity than BMI alone. Where:
WC = waist circumference (in centimetres)
Height = your height (in centimetres)
This exact formula appears consistently across recent clinical studies.BRI is calculated as 364.2 minus 365.5 multiplied by the square root of one minus waist circumference in centimetres divided by 2π, squared, divided by 0.5 times height in centimeters, squared.
How to Measure Your Waist Correctly
Accuracy matters here, so measure carefully:
Stand upright, feet shoulder-width apart, and breathe out normally (don't suck in your stomach).
Find the midpoint between the bottom of your lowest rib and the top of your hip bone (roughly at your belly button, but this can vary).
Wrap the tape measure around horizontally, keeping it snug but not compressing the skin.
Measure at the end of a normal exhale.
Quick Reference
Rather than do the math by hand, most people use an online BRI calculator (search "BRI calculator" — many universities and health sites host free ones) or, if you want to build a reusable tool, a simple spreadsheet with the formula above.
3. The Science: How BRI Relates to Insulin Resistance
What Is Insulin Resistance, in Plain Terms?
Insulin is the hormone that tells your cells to absorb glucose (sugar) from your bloodstream. When your cells stop responding well to insulin's signal — a state called insulin resistance (IR) — your pancreas compensates by pumping out more and more insulin to get the same job done. Over years, this compensation can fail, and blood sugar starts to climb. This is the slow-moving process that, left unaddressed, often ends in type 2 diabetes.
HOMA-IR: The Standard Clinical Proxy
The gold-standard way to measure insulin resistance directly is the hyperinsulinemic-euglycemic clamp — but it's expensive, invasive, and rarely used outside research settings. In everyday clinical practice and most studies, researchers instead use HOMA-IR (Homeostatic Model Assessment of Insulin Resistance)
HOMA-IR is one of the most widely used research tools for estimating insulin resistance. It is calculated using fasting blood glucose and fasting insulin levels. In general, a higher HOMA-IR score suggests poorer insulin sensitivity, although the interpretation depends on age, body weight, ethnicity, and the laboratory reference range.
There's no single universally agreed HOMA-IR cutoff — it varies by population, lab assay, and the outcome being predicted. Reported thresholds for "at-risk" insulin resistance commonly cluster around 1.62, identified through unsupervised machine learning analysis of clinical data, though other population-specific studies have placed clinically meaningful cutoffs at 1.85 in non-diabetic men and ranging from 2.05 to 3.46 depending on whether metabolic syndrome components are factored in. The takeaway: HOMA-IR cutoffs are context-dependent, so your doctor will interpret your number against your specific lab's reference range and your overall risk profile — not a single hard line.
Why BRI and Insulin Resistance Travel Together
The connective tissue (literally) between BRI and insulin resistance is visceral fat. Several mechanisms link the two:
Lipotoxicity — Visceral fat releases free fatty acids directly into the portal vein, which drains straight to the liver, promoting hepatic fat accumulation and impairing the liver's ability to regulate blood sugar.
Chronic low-grade inflammation — Visceral adipocytes secrete pro-inflammatory cytokines that directly interfere with insulin receptor signaling in muscle and fat cells.
Adiponectin suppression — Adiponectin is a hormone that normally improves insulin sensitivity. Visceral fat accumulation is associated with lower adiponectin, removing this protective signal. This relationship has been directly observed in skeletal research populations, where investigators noted that visceral fat volume and adiponectin are key determinants of insulin resistance, with findings showing lower adiponectin and higher visceral fat volume occurring together.
This is precisely why BRI — a proxy for visceral fat — correlates so consistently with HOMA-IR and Matsuda index (another insulin sensitivity marker) across the studies discussed below.
4. Clinical Interpretation: What Your BRI Number Actually Means
This is the section that matters most, so let's be direct about what the evidence shows and what it doesn't.
There Is No Single Universal "Healthy" BRI Cutoff
Unlike BMI (which has WHO-defined categories: underweight, normal, overweight, obese), BRI does not yet have a single internationally standardized cutoff. Different studies, in different populations, have derived different threshold values depending on the outcome being predicted. For example:
In a large cross-sectional study of over 17,000 Eastern Chinese adults, researchers identified optimal BRI cutoffs of approximately 3.49 in men under 60 and 3.46 in men 60 and older, and 3.47 in women under 60 versus 3.60 in women 60 and older, for discriminating high cardiometabolic risk.
A Mexican population study using ROC curve analysis found a BRI cutoff of 6.17 in females achieved high diagnostic accuracy for cardiometabolic risk and insulin resistance, with strong sensitivity and specificity, though this specific dataset's perfect-looking accuracy reflects a particular sample and shouldn't be read as a universal threshold.
What this means practically: rather than memorizing a single "good" or "bad" BRI number, the most clinically useful approach — and the one most studies actually use — is interpreting your BRI relative to population quartiles (lowest 25%, second 25%, third 25%, top 25%) or as a continuous risk gradient, where risk increases progressively as BRI rises, rather than flipping on/off at one threshold.
What a Higher BRI Quartile Actually Predicts
Here's where the clinical significance becomes concrete. In one of the largest and most rigorous analyses to date — a prospective study of 87,902 adults from the Kailuan cohort in China, followed for a median of nearly 14 years — researchers used multistate modeling to track exactly how BRI relates to disease progression over time. The results were striking: compared with the lowest BRI quartile, participants in the highest quartile had hazard ratios of 1.35, 1.69, and 2.08 for developing a first cardiometabolic disease across quartiles two through four, while the hazard ratios for cardiometabolic multimorbidity were 1.63, 2.05, and 2.99 respectively.
In plain terms: people in the highest BRI quartile had roughly triple the risk of developing two or more cardiometabolic conditions simultaneously, compared with people in the lowest quartile — even after adjusting for other known risk factors.
The same study also broke down where in the disease trajectory BRI matters most. The hazard ratio for transitioning from a healthy state to a first cardiometabolic disease was 2.08 in the highest versus the lowest BRI quartile, while the hazard ratio for progressing from a single cardiometabolic disease to multimorbidity was 1.61. This tells us BRI's predictive power is strongest for preventing the first disease from occurring at all, which is exactly when intervention has the most leverage.
BRI and Specific Conditions: What the Data Shows
Diffuse Idiopathic Skeletal Hyperostosis (DISH) — an unexpected but telling example. You might not expect a spinal condition to connect to abdominal fat, but a 2026 study of 1,258 elderly Japanese adults in the Bunkyo Health Study found that higher BRI and visceral fat volume were independently associated with DISH, with odds ratios of 1.5 and 1.01 respectively. The researchers concluded that BRI showed a stronger association with DISH than BMI did, as reflected by its higher confidence interval, and that BRI may be more suitable than BMI for simple assessment of visceral fat accumulation in clinical settings. The clinical takeaway: BRI's connection to metabolic dysfunction is broad enough to show up even in conditions that seem unrelated to obesity on the surface — which is itself a marker of how deeply visceral fat and insulin resistance are intertwined with whole-body health.
Intramuscular fat infiltration. A 2026 imaging study combining CT and MRI cohorts examined whether BRI could predict fat infiltration within muscle tissue (a marker linked to sarcopenia and reduced physical function in aging). The study explicitly aimed to compare the ability of BRI and BMI to predict intramuscular fat infiltration in the general population, building on prior evidence that BRI has shown superiority over BMI in predicting chronic kidney disease, cardiovascular disease, diabetes, metabolic syndrome, insulin resistance, and colorectal cancer.
MASLD (fatty liver) and downstream cardiometabolic disease. A 2026 UK Biobank study of over 109,000 people with MASLD examined nine different insulin-resistance-related indices — including a BRI-based composite (TyG-BRI) — to see which best predicted the development of cardiometabolic multimorbidity. Over a median follow-up of 15.9 years, 4,944 participants developed cardiometabolic multimorbidity, and higher levels of all insulin-resistance-related indices were linked to greater risk, with the strongest associations seen for waist-to-height-ratio-based and BMI-based composite indices, carrying hazard ratios between roughly 2.3 and 2.7 for the highest versus lowest quartile. Critically, the same analysis found that all of these indices modestly improved prediction of cardiometabolic multimorbidity beyond conventional risk factors alone — meaning BRI-related metrics add real, measurable value on top of what your doctor already checks (blood pressure, cholesterol, fasting glucose), rather than just duplicating that information.
5. BRI and Cardiometabolic Multimorbidity: Why "Multimorbidity" Is the Real Story
Most older anthropometric research asked a simpler question: does this measurement predict one disease? Newer studies — including most of the 2025–2026 literature cited throughout this article — ask a more clinically realistic question: does it predict the accumulation of multiple conditions over time?
This shift matters because in real life, cardiometabolic disease rarely arrives alone. Type 2 diabetes, coronary heart disease, and stroke frequently cluster together in the same person, often because they share upstream drivers — chief among them, insulin resistance and visceral adiposity. Cardiometabolic multimorbidity (CMM) is the term researchers use for having two or more of these conditions simultaneously, and it carries a substantially worse prognosis than any single condition alone.
This is exactly why the multistate modeling approach used in the Kailuan cohort study (referenced above) is so valuable: it doesn't just ask "is BRI linked to heart disease," it asks "does BRI predict how fast someone moves from healthy, to one disease, to multiple diseases, to death" — and the answer, with hazard ratios approaching 3.0 for the highest-risk quartile, is a clear yes.
Why This Matters for You, Practically
If your BRI is in a higher range, the clinical message isn't "you will definitely develop diabetes and heart disease." It's that your biological starting point makes the accumulation of multiple metabolic conditions over the coming decade more statistically likely than someone with a lower BRI, which is precisely the kind of information that should prompt earlier screening (fasting glucose, lipid panel, liver enzymes, blood pressure) rather than waiting for symptoms.
6. BRI vs. BMI vs. Waist Circumference vs. HOMA-IR
The Core Metrics
BMI (Body Mass Index)
What it measures: Weight relative to height squared.
Blood draw required: No.
Strength: Simple, globally standardized, and backed by decades of reference data.
Limitation: Cannot distinguish muscle from fat or track fat location. It frequently misclassifies athletic individuals as "overweight" and misses "normal-weight obese" individuals (those with normal weight but high body fat percentage).
Waist Circumference
What it measures: A single measure of abdominal fat (central adiposity).
Blood draw required: No.
Strength: Captures dangerous central fat much better than BMI alone.
Limitation: Fails to account for height. A tall person and a short person with the identical waist measurement carry vastly different health risks.
BRI (Body Roundness Index)
What it measures: Estimated visceral and total body fat percentage using a geometric formula of waist circumference and height.
Blood draw required: No.
Strength: Outperforms BMI in multiple head-to-head studies for predicting cardiometabolic risk, heart disease (ASCVD), and all-cause mortality.
Limitation: No universal clinical cutoff has been established yet. The current evidence relies heavily on cross-sectional studies, making causal direction harder to definitively prove.
HOMA-IR
What it measures: A direct estimate of insulin resistance calculated from fasting insulin and fasting glucose levels.
Blood draw required: Yes.
Strength: Gets much closer to the actual biological mechanism of disease (insulin signaling).
Limitation: Requires a formal lab visit. Ideal cutoff numbers vary by population and the specific lab assay used, and it does not capture physical fat distribution.
Waist-to-Height Ratio (WHtR)
What it measures: Waist circumference relative to height.
Blood draw required: No.
Strength: Features a simple, universal, and easy-to-remember threshold (keep your waist to less than half your height).
Limitation: Less granular than BRI because it doesn't model the human body's shape geometrically.
The Practical Takeaway
Complementary, Not Competitive: BRI and HOMA-IR serve different purposes. BRI is a free, at-home structural screening signal, while HOMA-IR (or the less expensive TyG index alternative) serves as the lab-based biochemical confirmation.
The Power of Combining Signals: Leading research—including the UK Biobank MASLD (fatty liver disease) analysis—deliberately merges these tools into composite scores like TyG-BRI. Pairing a physical body measurement with a blood chemical signal drastically improves predictive accuracy beyond using either tool alone.
7. Evidence Summary: Key Studies at a Glance
1. Predicting Severe Cardiometabolic Risk
These massive cohort studies show a direct link between high body roundness and long-term, multi-disease health outcomes.
The Kailuan Cohort Study (Cai et al., 2025 | Obesity)
Population: 87,902 adults in China tracked over a 13.7-year follow-up.
Key Finding: Adults in the highest BRI quartile had a nearly 3x higher risk (HR 2.99) of developing cardiometabolic multimorbidity (having multiple conditions like heart disease and stroke simultaneously). They also faced twice the risk (HR 2.08) of transitioning from perfect health to their very first chronic disease.
The UK Biobank MASLD Analysis (Sun, He, Wang et al., 2026 | Cardiovascular Diabetology)
Population: 109,604 UK adults with Metabolic Dysfunction-Associated Steatotic Liver Disease (MASLD), tracked over a 15.9-year median follow-up.
Key Finding: All nine evaluated insulin-resistance indices significantly predicted severe metabolic illness. Combined biochemical-anthropometric scores like TyG-BRI showed the strongest predictive power, with the top quartile carrying a 2.3x to 2.7x higher risk of multi-disease progression than the bottom quartile.
Eastern Chinese Adult Study (Xu et al., 2021 | BMC Cardiovascular Disorders)
Population: ~17,000 adults.
Key Finding: High BRI was strongly tied to elevated cardiometabolic risk (OR 3.27). This study successfully mapped out sex- and age-specific clinical cutoffs for BRI, pinning the ideal threshold between 3.46 and 3.60.
2. Outperforming BMI in Specific Tissue and Bone Conditions
These studies highlight how looking at "roundness" and shape yields deep biological insights that simple height-to-weight ratios (BMI) entirely miss.
The Bunkyo Health Study (Sugawara, Nojiri et al., 2026 | Scientific Reports)
Population: 1,258 elderly Japanese adults.
Key Finding: High BRI is independently associated with a 1.5x higher odds of Diffuse Idiopathic Skeletal Hyperostosis (DISH)—a condition where ligaments around the spine calcify. Crucially, BRI significantly outperformed BMI in detecting this specific skeletal risk.
The Muscle Infiltration Study (Yu, Wang et al., 2026 | Frontiers in Nutrition)
Population: 1,268 adults evaluated via CT scans alongside a 198-adult MRI cohort.
Key Finding: BRI was directly compared against BMI to evaluate intramuscular fat infiltration (fat marbled inside muscle tissue). The study confirmed BRI's superiority, building on previous evidence that it better tracks insulin resistance, diabetes, and metabolic syndrome.
3. Global Variability & Threshold Nuances
Biomarkers are rarely "one size fits all." These data points highlight why localized baseline data is crucial.
The South African Rural Cohort (Nkwana, Monyeki & Lebelo, 2021 | IJERPH)
Population: Young adults living in rural South Africa.
Key Finding: This research successfully established reliable baselines for BRI, A Body Shape Index (ABSI), and the Conicity Index within an understudied population, validating their use for tracking nutritional status and early cardiovascular risks.
HOMA-IR Cutoff Meta-Analyses (Abdesselam et al.; EPIRCE Study)
Population: Diverse adult populations across Oman and Spain.
Key Finding: Confirmed there is no universal HOMA-IR threshold. Depending on the specific population, the lab assay used, and the clinical outcomes being measured, ideal cutoffs range anywhere from 1.6 to 3.5
.A note on study design limitations: the large majority of BRI research — including several studies above — is cross-sectional or, at best, a single prospective cohort. This means most studies can show association, not definitive causation. The Kailuan and UK Biobank studies are valuable specifically because their large sample sizes and multi-year follow-up periods allow for stronger (though still observational, not randomized) causal inference. No study in this body of literature has used a randomized controlled design, because you cannot ethically or practically randomize people to different visceral fat levels.
8. How to Lower Your BRI: Practical, Evidence-Based Steps
Because BRI is driven primarily by waist circumference relative to height, lowering it means reducing visceral fat specifically — not just losing weight on a scale. The good news: visceral fat tends to respond faster to lifestyle changes than subcutaneous fat does.
Step 1: Prioritize Aerobic Exercise (Especially Moderate-to-Vigorous Intensity)
Research consistently shows aerobic exercise preferentially reduces visceral fat, even in the absence of large amounts of total weight loss. Aim for:
150–300 minutes per week of moderate-intensity cardio (brisk walking, cycling, swimming), per general physical activity guidelines, OR
75–150 minutes per week of vigorous-intensity activity (running, HIIT, fast cycling)
Step 2: Add Resistance Training
Building muscle mass improves insulin sensitivity independent of fat loss, because muscle tissue is a major site of glucose uptake. Two to three sessions per week, covering all major muscle groups, is a reasonable evidence-based target.
Step 3: Address Diet Quality, Not Just Calories
Reduce added sugars and refined carbohydrates, which drive the insulin spikes most strongly linked to fat storage around the abdomen.
Increase fiber intake (aim for 25–35g/day from vegetables, legumes, and whole grains) — fiber slows glucose absorption and supports a healthier gut microbiome, which has its own links to visceral fat regulation.
Prioritize protein at each meal to support satiety and preserve muscle mass during any weight loss.
Step 4: Prioritize Sleep and Manage Stress
Chronic sleep deprivation and elevated cortisol (from chronic stress) both independently promote visceral fat accumulation, even when calorie intake doesn't change. Aim for 7–9 hours of consistent sleep.
Step 5: Reduce Alcohol Intake
Alcohol is calorically dense, disrupts sleep architecture, and has direct effects on liver fat accumulation — all of which compound visceral fat risk.
A Realistic Checklist
[ ] Measure your waist circumference correctly and calculate your starting BRI
[ ] Schedule 3–5 cardio sessions per week
[ ] Add 2–3 resistance training sessions per week
[ ] Track added sugar intake for one week as a baseline
[ ] Set a consistent sleep and wake time
[ ] Re-measure waist circumference monthly (same time of day, same conditions)
[ ] If you have access to labs, ask your doctor about checking fasting glucose, insulin, and a lipid panel
Safety note: if you have any existing cardiovascular condition, are pregnant, or are managing diabetes with medication, talk to your doctor before starting a new exercise program — particularly before vigorous-intensity training, which may require adjustments to insulin or other medication dosing.
9. Common Myths and Mistakes About BRI
Myth #1: "A high BRI means I definitely have insulin resistance or will get diabetes." False. BRI is a probabilistic risk indicator, not a diagnosis. It shifts the odds; it doesn't determine the outcome. Many people with elevated BRI never develop metabolic disease, especially if other risk factors (genetics, activity level, diet quality) are favorable.
Myth #2: "BRI replaces the need for blood tests." False. BRI is a screening signal, not a diagnostic substitute for fasting glucose, HbA1c, lipid panels, or liver enzymes. The strongest studies in this field explicitly combine BRI-type measures with blood-based markers (like the TyG-BRI composite index) because neither alone tells the full story.
Myth #3: "There's one universal 'healthy' BRI number everyone should aim for." False, at least currently. As shown above, optimal cutoffs vary meaningfully by sex, age, and population studied. Treat BRI as a trend to track over time relative to yourself, and a risk gradient relative to population data — not a single pass/fail line.
Myth #4: "If my BMI is normal, my BRI doesn't matter." This is exactly backward, and arguably the single most clinically important myth to correct. The entire reason BRI gained research attention is that it catches "normal-weight" people who are still carrying substantial visceral fat — a phenomenon sometimes called "normal weight obesity" or being "TOFI" (thin outside, fat inside). If anything, BRI is most useful precisely in this group, where BMI alone would offer false reassurance.
Myth #5: "Spot reduction exercises (crunches, ab workouts) lower visceral fat and BRI." False. You cannot selectively burn fat from one location through targeted exercises. Visceral fat responds to overall caloric balance, aerobic activity, and metabolic health improvements — not ab-specific training.
10. Frequently Asked Questions
1. What is a good BRI score? There's no single universally agreed "good" score, but generally, lower BRI values (often below roughly 3–4, depending on the population and study) are associated with lower cardiometabolic risk, while values in the highest population quartile (often above 5–6, again population-dependent) are associated with substantially higher risk. Tracking your own BRI trend over time is more clinically useful than chasing one fixed number.
2. Is BRI better than BMI? For predicting visceral fat and several cardiometabolic outcomes specifically, multiple studies have found BRI outperforms BMI, including for diffuse idiopathic skeletal hyperostosis, intramuscular fat infiltration, and general cardiometabolic risk clustering. However, BMI remains useful, well-validated for general population screening, and far simpler to calculate. They're best used together, not as competitors.
3. Does BRI predict diabetes risk? Yes — BRI-related indices have shown meaningful associations with diabetes risk and insulin resistance markers across multiple independent study populations, including composite indices like TyG-BRI that combine BRI with blood glucose data.
4. Can I calculate BRI without a doctor's visit? Yes. You only need your height and waist circumference, both of which you can measure at home with a tape measure. No blood draw or imaging is required for the BRI formula itself.
5. How is BRI different from waist-to-height ratio (WHtR)? Both use waist circumference and height, but BRI applies a geometric (ellipse-based) transformation to those numbers that was specifically validated against measured visceral fat and DXA body composition data. WHtR is simpler (just a ratio) but somewhat less granular in its risk stratification.
6. Is a high BRI reversible? Visceral fat — and by extension BRI — tends to respond relatively well to consistent lifestyle changes, often faster than subcutaneous fat. Aerobic exercise, resistance training, dietary changes, and improved sleep have all been linked to visceral fat reduction in clinical research.
7. Does BRI apply equally to men and women? No — several studies show meaningfully different optimal BRI cutoffs by sex (and by age within sex), reflecting underlying differences in typical fat distribution patterns between men and women. Don't compare your BRI directly against a partner or friend of the opposite sex as if the same number means the same risk.
8. What's the relationship between BRI and HOMA-IR specifically? They measure related but distinct things: BRI estimates visceral fat from body measurements, while HOMA-IR directly estimates insulin resistance from a fasting blood draw. They tend to correlate because visceral fat is a major driver of insulin resistance, but they aren't interchangeable, and the strongest clinical studies often use them together (as in TyG-BRI composite indices).
9. Can children and teens use BRI? Pediatric-specific research exists and suggests BRI may have value in younger populations too, though reference ranges and cutoffs for children differ from adults and are a more recent, less-established area of study. Pediatric cardiometabolic screening decisions should be made with a pediatrician.
10. Does ethnicity affect BRI interpretation? Likely yes, though this is an area of ongoing study. Body fat distribution patterns and the relationship between visceral fat and metabolic risk are known to vary by ethnicity for other anthropometric measures (like BMI and waist circumference), and emerging BRI research across different countries (China, Japan, Korea, the US, South Africa) reflects growing attention to this question — but a fully resolved, ethnicity-specific BRI cutoff system does not yet exist in the literature.
11. Should I be worried if my BRI is high but all my blood tests are normal? Not panicked, but it's worth paying attention to as an early signal. Visceral fat accumulation and the metabolic disruptions it causes often precede detectable changes in standard blood tests by months to years. A high BRI with currently normal labs is a reasonable prompt for proactive lifestyle changes and periodic re-testing, not an emergency.
12. How often should I recalculate my BRI? Monthly is reasonable for tracking a lifestyle change, using consistent measurement technique (same time of day, similar hydration/food status). There's no clinical guideline mandating a specific frequency, since BRI isn't yet part of standard care protocols the way blood pressure or BMI checks are.
11. Conclusion: What to Do With This Information
The Body Roundness Index isn't a magic number, and it isn't a diagnosis. What it is: a free, accessible, evidence-backed screening signal that captures something BMI consistently misses — where your fat lives, not just how much of it there is. Across cohorts spanning hundreds of thousands of people in China, the UK, Japan, and beyond, higher BRI consistently tracks with higher rates of insulin resistance, fatty liver disease, and the kind of compounding, multi-system cardiometabolic disease that's hardest to treat once it takes hold.
Your concrete next steps:
Calculate your BRI today using your height and waist circumference.
Don't fixate on a single cutoff — think in terms of trend and population quartile, not pass/fail.
If your BRI is elevated, prioritize the basics that move it: aerobic exercise, resistance training, fiber and protein-forward eating, sleep, and reduced alcohol intake.
Pair it with real data when you can — ask your doctor about a fasting glucose, lipid panel, and (if relevant) HOMA-IR or insulin level, especially if your BRI is in a higher range or you have a family history of diabetes or heart disease.
Re-measure periodically to track whether your changes are working — this is where BRI's simplicity becomes genuinely useful as a free, repeatable home metric.
This isn't about chasing a number for its own sake. It's about using an early, low-cost signal to catch metabolic risk before it becomes metabolic disease — while there's still the most room to change the trajectory.
This article is for educational purposes and does not constitute medical advice. Please consult your physician before making significant changes to your diet or exercise routine, especially if you have existing health conditions.
Disclaimer: This article is for informational purposes only and does not constitute medical advice. Individual circumstances vary, and treatment decisions should always be made in consultation with qualified healthcare professionals.
Related Articles
Why Your Scale Isn’t Moving: The Science of Fat Burning Beyond Weight Loss | DR T S DIDWAL
How Glycemic Index and Glycemic Load Influence Type 2 Diabetes | DR T S DIDWAL
The Metabolic Triad: Why Diabetes, Obesity & CVD Are One Epidemic | DR T S DIDWAL
References
Thomas, D.M., et al. (2013). Relationships between body roundness with body fat and visceral adipose tissue emerging from a new geometrical model. Obesity (Silver Spring), 21(11), 2264–2271. https://doi.org/10.1002/oby.20408
Cai, X., et al. (2025). Body Roundness Index Associated With Cardiometabolic Multimorbidity and Mortality: A Multistate Model. Obesity. https://doi.org/10.1002/oby.70032
Sun, M., He, Q., Wang, Y., et al. (2026). Associations of insulin resistance-related indices with the risk and progression of cardiometabolic multimorbidity in individuals with metabolic dysfunction-associated steatotic liver disease: a prospective cohort study. Cardiovascular Diabetology. https://doi.org/10.1186/s12933-026-03264-3
Sugawara, Y., Nojiri, H., Nagao, M., et al. (2026). Association between body roundness index and the prevalence of diffuse idiopathic skeletal hyperostosis in elderly patients: the Bunkyo health study. Scientific Reports, 16, 15922. https://doi.org/10.1038/s41598-026-47398-6
Yu, R., Wang, Y., Zhang, Y., Gao, X., Zhang, D., Wang, J., & Chen, X. (2026). Body roundness index: superior predictors of intramuscular fat infiltration in general population. Frontiers in Nutrition, 13:1721126. https://doi.org/10.3389/fnut.2026.1721126
Nkwana, M.R., Monyeki, K.D., & Lebelo, S.L. (2021). Body Roundness Index, A Body Shape Index, Conicity Index, and Their Association with Nutritional Status and Cardiovascular Risk Factors in South African Rural Young Adults. International Journal of Environmental Research and Public Health, 18(1), 281. https://doi.org/10.3390/ijerph18010281
Xu, J., Zhang, L., Wu, Q., Zhou, Y., Jin, Z., Li, Z., & Zhu, Y. (2021). Body roundness index is a superior indicator to associate with the cardio-metabolic risk: evidence from a cross-sectional study with 17,000 Eastern-China adults. BMC Cardiovascular Disorders, 21(1), 97. https://doi.org/10.1186/s12872-021-01905-x
Abdesselam, A., Zidoum, H., Zadjali, F., et al. (2021). Estimate of the HOMA-IR Cut-off Value for Identifying Subjects at Risk of Insulin Resistance Using a Machine Learning Approach. https://doi.org/10.18295/squmj.4.2021.030
EPIRCE Study Group. Insulin resistance (HOMA-IR) cut-off values and the metabolic syndrome in a general adult population: effect of gender and age. BMC Endocrine Disorders / PMC.
Yang, M., Liu, J., Shen, Q., et al. (2024). Body roundness index trajectories and the incidence of cardiovascular disease: evidence from the China Health and Retirement Longitudinal Study. Journal of the American Heart Association, 13(19), e034768. https://doi.org/10.1161/JAHA.124.034768
Rico-Martín, S., Calderón-García, J.F., Sánchez-Rey, P., et al. (2020). Effectiveness of body roundness index in predicting metabolic syndrome: A systematic review and meta-analysis. Obesity Reviews, 21, e13023. https://doi.org/10.1111/obr.13023
Lin, H., et al. (2025). Association of body roundness index with cardiovascular disease and all-cause mortality among Chinese adults. Diabetes, Obesity and Metabolism. https://doi.org/10.1111/dom.16272
Qiu, L., Xiao, Z., Fan, B., Li, L., & Sun, G. (2024). Association of body roundness index with diabetes and prediabetes in US adults from NHANES 2007–2018: a cross-sectional study. Lipids in Health and Disease, 23(1), 252. https://doi.org/10.1186/s12944-024-02238-2
Naito, H., et al. (2024). Fat Accumulation and Elevated Free Fatty Acid Are Associated With Age-Related Glucose Intolerance: Bunkyo Health Study. Journal of the Endocrine Society, 8, bvad164. https://doi.org/10.1210/jendso/bvad164
Tao, L., Miao, L., Guo, Y.J., Liu, Y.L., Xiao, L.H., & Yang, Z.J. (2024). Associations of body roundness index with cardiovascular and all-cause mortality: NHANES 2001–2018. Journal of Human Hypertension, 38(2), 120–127.
Jahan, A., Abdullah, M.M., Frank, R., et al. (2026). Body Roundness Index is a Stronger Predictor of Cardiometabolic Risk than Body Mass Index in Children between Ages 8 to 17 years. Journal of Pediatrics, 288, 114826. https://doi.org/10.1016/j.jpeds.2025.114826
Matsuda, M., & DeFronzo, R.A. (1999). Insulin sensitivity indices obtained from oral glucose tolerance testing: comparison with the euglycemic insulin clamp. Diabetes Care, 22, 1462–1470. https://doi.org/10.2337/diacare.22.9.1462