Blood Tests That Reveal Visceral Fat (No Scan Needed): HOMA-IR, TG/HDL & More
Discover how blood tests like HOMA-IR, TG/HDL ratio, and ALT reveal hidden visceral fat—no scan needed. Detect metabolic risk early.
OBESITY
Dr. T.S. Didwal, M.D.(Internal Medicine)
4/4/202616 min read
Visceral fat can be detected without imaging by analyzing specific blood markers. The most reliable indicators include HOMA-IR (insulin resistance), triglyceride-to-HDL ratio (TG/HDL), liver enzymes (ALT), and the TyG index. These markers reflect the metabolic activity of visceral fat, which drives insulin resistance, inflammation, and fatty liver disease. When interpreted together, they provide a clinically accurate, low-cost way to identify hidden visceral fat early—often years before symptoms appear.
Blood tests that reveal visceral fat include:
HOMA-IR – measures insulin resistance
Fasting insulin – detects early hyperinsulinemia
TG/HDL ratio – indicates atherogenic dyslipidemia
TyG index – combines triglycerides and glucose
ALT (liver enzyme) – signals fatty liver (NAFLD)
hs-CRP – reflects chronic inflammation
The “3-Signal Model of Hidden Visceral Fat”
Insulin resistance → HOMA-IR
Lipid dysfunction → TG/HDL
Liver stress → ALT
Red Flag Pattern
HOMA-IR > 2.5
TG/HDL > 3 (or >2 South Asians)
ALT > 30
→ High likelihood of visceral adiposity + NAFLD
Clinical Pearls
1. The "Insulin-First" Rule
Scientific Perspective: Hyperinsulinemia is a compensatory mechanism that precedes hyperglycemia by 10 to 15 years. Using HOMA-IR reveals the pancreas's "overtime work" long before fasting glucose exceeds 100 mg/dL}
Your blood sugar might look "normal" only because your body is pumping out massive amounts of insulin to keep it there. Checking only glucose is like checking a dam's water level, but ignoring the structural cracks in the wall.
2. The South Asian "Metabolic Shift"
Scientific Perspective: South Asian phenotypes exhibit limits in "Adipose Tissue Expandability". They store visceral fat at significantly lower BMI thresholds (starting at 23 instead of 25) and have a higher propensity for Low HDL and High TG, even in the absence of obesity.
Don't let a "healthy" BMI of 22 or 23 fool you. If you are of South Asian descent, your body stores "toxic" fat around your organs much earlier than other groups. Your "normal" weight range is narrower than what global charts suggest.
3. ALT: The Liver's Early Warning
Scientific Perspective: The "Normal" range for ALT, often up to 40- 50 U/L, is historically calibrated to populations with undiagnosed fatty liver. In healthy, lean cohorts, the true upper limit of normal for ALT is closer to 25U/L for men and 19 U/L for women.
If your ALT is 35, your lab report will say it's "Normal," but it actually signals that your liver is likely starting to accumulate fat. Aim for the "Optimal" range (under 25), not just the "Lab Normal" range.
4. TG/HDL: The "Quality vs. Quantity" Marker
Scientific Perspective: While LDL-C measures total cholesterol mass, the TG/HDL ratio is a superior proxy for LDL particle size. A ratio >3.0 strongly correlates with small, dense LDL (Pattern B), which is significantly more atherogenic than large, buoyant particles.
It’s not just about how much cholesterol you have; it’s about how "sticky" and "small" it is. A high Triglyceride-to-HDL ratio means your blood contains small, rusty-colored particles that get trapped in your arteries more easily.
5. The "Sarcopenic Obesity" Trap
Scientific Perspective: Visceral fat often masks a loss of lean muscle mass (sarcopenia). A "stable" weight can be an illusion where the patient is simultaneously gaining visceral fat and losing skeletal muscle, leading to a massive drop in Metabolic Rate and Insulin Sensitivity.
Losing "weight" is the wrong goal; you want to lose fat while keeping muscle. If the scale stays the same but your waist grows, you are getting "metabolically older" regardless of your weight. Strength training is the best "antidote" to visceral fat.
Clinician-Reviewed · Metabolic Health
Blood Tests That Reveal Visceral Fat (Even Without a Scan)
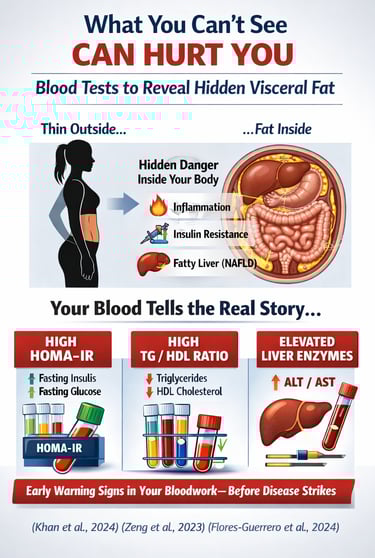
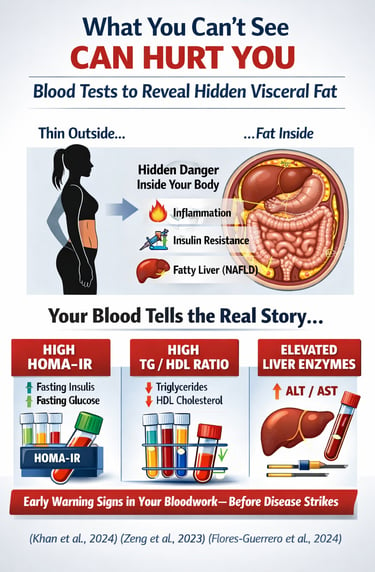
Most people assume that dangerous belly fat is something you can see in the mirror. In reality, the most harmful fat in the human body—visceral fat—often remains completely invisible. You can have a normal weight, a normal body mass index (BMI), and still carry a significant burden of fat wrapped deep around your liver, pancreas, and intestines. This phenotype, often described as “thin outside, fat inside” (TOFI), is increasingly recognized as a major driver of metabolic disease worldwide (Khan et al., 2024).
What makes visceral fat particularly dangerous is not just where it is, but what it does. Unlike subcutaneous fat, visceral adipose tissue is metabolically active. It continuously releases free fatty acids, inflammatory cytokines such as TNF-α and IL-6, and hormone-like signals that directly disrupt insulin action and promote atherogenic dyslipidemia (Yuri et al., 2026).. Critically, these substances drain into the liver through the portal circulation, triggering hepatic insulin resistance, increased triglyceride production, and early non-alcoholic fatty liver disease (NAFLD) (Zeng et al., 2023a).
Here is the paradox: while this process is biologically aggressive, it is also detectable—long before symptoms appear—through simple blood tests. Patterns such as elevated fasting insulin, an increased triglyceride-to-HDL ratio, and mildly abnormal liver enzymes form a recognizable metabolic signature of visceral fat accumulation (Flores-Guerrero et al., 2024). In fact, these biomarkers often shift years before glucose levels rise or overt disease is diagnosed.
This means that your routine blood work is not just a snapshot of your current health—it is an early warning system. The key lies in knowing what to look for, how to interpret the patterns, and how to act on them before irreversible damage occurs.
Why Your Blood Reflects What Your Belly Hides
Unlike subcutaneous fat (the fat you can pinch), visceral fat sits deep in the abdominal cavity, draining directly into the portal vein — the blood vessel that feeds your liver. This anatomical shortcut is why visceral fat has such outsized metabolic consequences: free fatty acids, inflammatory cytokines like TNF-α and IL-6, and disrupted adipokines like adiponectin flood the liver first, before reaching any other organ (Yuri et al., 2026).
The liver responds predictably: it becomes insulin-resistant, overproduces VLDL particles (raising triglycerides), and accumulates fat itself — a condition known as non-alcoholic fatty liver disease (NAFLD). Each of these responses leaves a detectable trace in routine bloodwork.
Clinical Insight Think of visceral fat as a gland with a bad personality. It actively secretes substances that raise your cardiovascular risk, impair glucose control, and promote systemic inflammation — all of which show up as specific, measurable patterns in blood tests.
Biomarker #1 — HOMA-IR: The Insulin Resistance Signal
The single most powerful, low-cost indicator of visceral adiposity is HOMA-IR (Homeostatic Model Assessment of Insulin Resistance). It is calculated from two ordinary fasting blood values:
Formula HOMA-IR = (Fasting Insulin [µIU/mL] × Fasting Glucose [mmol/L]) ÷ 22.5
A value above 2.0–2.5 suggests insulin resistance in most populations.
Why does this matter for visceral fat specifically? Because excess visceral fat directly impairs insulin signalling in the liver, the very organ that governs glucose metabolism. Research confirms that HOMA-IR is an effective biomarker of NAFLD even in individuals without diabetes, making it invaluable for identifying visceral fat accumulation before overt disease develops (Zeng et al., 2023b).
The "Normal Glucose, High Insulin" Trap
This is where many patients — and some clinicians — are caught off guard. Fasting glucose alone is a late-stage marker. Hyperinsulinemia, the body's compensatory response to early insulin resistance, occurs years before blood sugar rises. If you check only glucose, you will miss the problem in its most treatable window.
⚠️ Key Takeaway: Early visceral fat accumulation = high insulin with normal glucose. Always request fasting insulin alongside fasting glucose.
Biomarker #2 — The TG/HDL Ratio: Atherogenic Dyslipidemia
The Triglyceride-to-HDL Cholesterol ratio is arguably the most underused marker in routine metabolic screening. It is calculated simply by dividing your fasting triglycerides by your HDL cholesterol — both of which appear on a standard lipid panel.
TG/HDL RatioInterpretationPopulation Note< 2.0OptimalAll populations2.0 – 3.0Borderline — monitorCaution in South Asians at lower cut-off> 3.0High risk — action neededWestern populations> 2.0Elevated riskSouth Asian, Indian subcontinent
Visceral fat drives hepatic overproduction of VLDL particles — raising triglycerides — while simultaneously impairing reverse cholesterol transport, which lowers HDL. The result is a characteristic "atherogenic dyslipidemia" pattern. Multiple studies confirm the TG/HDL ratio functions as a reliable surrogate marker for small dense LDL particles and insulin resistance (Khan et al., 2024; Baneu et al., 2024).
Crucially, a 2024 study found that the TG/HDL ratio also correlates significantly with subclinical atherosclerosis and incident cardiovascular disease — meaning it is not merely diagnostic, but predictive (Flores-Guerrero et al., 2024).
Biomarker #3 — The TyG Index: Combining Triglycerides and Glucose
The Triglyceride-Glucose (TyG) Index takes insulin resistance assessment one step further by combining the two most accessible metabolic markers:
Formula TyG Index = ln[Triglycerides (mg/dL) × Fasting Glucose (mg/dL) / 2]
Values above 8.5 are associated with significant insulin resistance and NAFLD risk.
A landmark comparison study found that the TyG index performs comparably to HOMA-IR in predicting both prevalence and incidence of metabolic syndrome — but with a key practical advantage: it does not require a fasting insulin measurement, which is not universally available (Son et al., 2022). This makes the TyG index particularly useful in resource-limited clinical settings.
Biomarker #4 — Liver Enzymes: Your Liver Is Talking
Because visceral fat drains directly into the portal circulation, the liver is the first organ to be damaged. Elevated liver enzymes — particularly ALT (alanine aminotransferase) — are one of the earliest detectable consequences of visceral fat accumulation and hepatic insulin resistance (Zeng et al., 2023a).
ALT
Most sensitive hepatic marker. Even mildly elevated ALT (above 25–30 U/L) in a non-drinker warrants metabolic investigation for visceral fat and NAFLD.
AST/ALT Ratio
Ratio below 1.0 typical in early NAFLD. As fibrosis progresses, AST rises disproportionately. Useful for staging liver involvement.
GGT
Gamma-glutamyl transferase reflects oxidative stress. A strong, independent predictor of metabolic syndrom even when ALT is normal.
ALP
Less specific but rises in advanced hepatic fat accumulation. Should always be interpreted alongside ALT and GGT.
,
Biomarker #5 — Inflammatory Markers: CRP and Beyond
Visceral adipose tissue is a prolific producer of pro-inflammatory cytokines — including IL-6 and TNF-α. These drive systemic, low-grade chronic inflammation that dramatically amplifies cardiovascular and metabolic risk.
High-sensitivity CRP (hs-CRP) is the most clinically accessible inflammatory marker. Values above 3 mg/L in the absence of acute infection suggest metabolic inflammation driven by visceral adiposity. Levels above 1 mg/L warrant attention in the context of other metabolic risk factors.
Think of hs-CRP as your body's "inflammation fire alarm." Visceral fat keeps this alarm softly — but constantly — ringing. Over time, this chronic low-level signal damages blood vessels in the same way that a slow gas leak can eventually cause a fire.
Emerging Biomarkers for Detecting Visceral Fat
Recent research is identifying novel metabolic biomarkers that may improve early detection of visceral adiposity beyond traditional markers like HOMA-IR and TG/HDL ratio.
Adiponectin–Leptin Ratio (ALR):
A sensitive indicator of adipose tissue dysfunction. Low adiponectin combined with high leptin reflects visceral fat accumulation and insulin resistance more accurately than either hormone alone.Remnant Cholesterol:
Represents cholesterol carried in triglyceride-rich lipoproteins (VLDL remnants). Elevated levels are strongly associated with visceral adiposity, NAFLD, and increased cardiovascular risk.GlycA:
A nuclear magnetic resonance–derived marker of chronic systemic inflammation, increasingly linked with obesity-related metabolic dysfunction and cardiometabolic risk.Branched-Chain Amino Acids (BCAAs):
Elevated circulating levels of leucine, isoleucine, and valine are emerging markers of early insulin resistance and impaired mitochondrial metabolism in visceral obesity.FGF21 (Fibroblast Growth Factor-21):
A metabolic hormone released by the liver that rises in states of hepatic fat accumulation and metabolic stress, making it a potential early signal of NAFLD and visceral fat burden.
Clinical Perspective:
While these biomarkers show promise, most remain research or specialized laboratory markers. Currently, traditional tests—fasting insulin, HOMA-IR, TG/HDL ratio, and liver enzymes—remain the most practical and validated tools for routine clinical screening.
Building Your "Visceral Fat Blood Panel"
No single test is definitive on its own. The power comes from pattern recognition — reading multiple markers together as a metabolic signature.
Minimal Panel (Primary Care — Any Lab)
Fasting glucose — baseline metabolic status
Fasting insulin → calculate HOMA-IR
Full lipid profile → derive TG/HDL ratio and TyG index
ALT — hepatic fat sentinel
Advanced Panel (Metabolic Clinic)
ApoB — particle number, more predictive than LDL-C alone
hs-CRP — inflammatory burden
GGT — oxidative stress and metabolic syndrome marker
Adiponectin — inversely correlated with visceral fat mass
Fasting insulin + Fasting glucose → both HOMA-IR and TyG index
Summary of Metabolic Red Flags & Targeted Interventions
HOMA-IR > 2.0 (Insulin Resistance)
Indicates early metabolic dysfunction driven by visceral fat
Action: Eliminate refined starches and sugars; prioritise high-fibre, protein-rich meals to improve insulin sensitivity
TG/HDL Ratio > 3.0 (Western) / > 2.0 (Asian)
Reflects atherogenic dyslipidemia and hepatic overproduction of VLDL
Action: Remove liquid sugars (soda, fruit juices); incorporate regular Zone 2 aerobic exercise to improve lipid metabolism
ALT > 25 U/L (Liver Stress / NAFLD Risk)
Suggests early hepatic fat accumulation is linked to visceral adiposity
Action: Eliminate excess fructose and alcohol; target ≥5% body weight reduction to reverse fatty liver changes
hs-CRP > 1.0 mg/L (Chronic Inflammation)
Indicates low-grade systemic inflammation driven by adipose-derived cytokines
Action: Optimize sleep quality; adopt an anti-inflammatory dietary pattern rich in omega-3 fats and whole foods
Waist-to-Height Ratio > 0.5 (Central Adiposity)
Simple anthropometric marker of excess visceral fat
Action: Initiate resistance training to increase lean muscle mass and create a metabolic “sink” for glucose disposal
Clinical Patterns: What Your Blood Markers Are Telling You
High HOMA-IR + High TG/HDL Ratio
Likely Diagnosis: Visceral adiposity with insulin resistance
Next Step: Initiate structured lifestyle intervention (diet + exercise); consider comprehensive metabolic evaluation
Normal BMI + Abnormal Metabolic Markers
Likely Diagnosis: TOFI phenotype (Thin Outside, Fat Inside)
Next Step: Consider visceral fat assessment (imaging if available); implement aggressive lifestyle modification despite normal weight
Elevated ALT + High TyG Index
Likely Diagnosis: Non-alcoholic fatty liver disease (NAFLD) with insulin resistance
Next Step: Order hepatic imaging (ultrasound/FibroScan); refer for dietary and metabolic management
Low HDL + High Triglycerides + Elevated hs-CRP
Likely Diagnosis: Metabolic syndrome with inflammatory component
Next Step: Perform comprehensive cardiovascular and metabolic risk stratification; initiate multi-target intervention
High Fasting Insulin + Normal Glucose
Likely Diagnosis: Early insulin resistance (pre-diabetic stage) with emerging visceral adiposity
Next Step: Begin targeted dietary intervention; repeat metabolic testing in 3 months to assess progression or reversal
Key Takeaways
Visceral fat is a metabolic disease, not a cosmetic issue.
Unlike subcutaneous fat, visceral adipose tissue behaves as an endocrine organ, actively secreting free fatty acids, pro-inflammatory cytokines, and adipokines that disrupt systemic metabolism and accelerate cardiometabolic risk.The danger lies in invisibility.
Patients with normal BMI frequently harbor significant visceral fat—commonly described as the “thin outside, fat inside” (TOFI) phenotype—making visual assessment and weight alone clinically unreliable.Blood biomarkers provide an early diagnostic window.
Long before overt disease manifests, subtle abnormalities in routine blood tests reveal the metabolic footprint of visceral adiposity, enabling early detection and intervention.Insulin resistance is the central signal.
Elevated fasting insulin and increased HOMA-IR reflect hepatic and peripheral insulin resistance, often preceding hyperglycemia by years and serving as one of the earliest indicators of visceral fat accumulation.Atherogenic dyslipidemia strengthens the signal.
The triglyceride-to-HDL ratio captures the characteristic lipid disturbance driven by hepatic VLDL overproduction and impaired lipid clearance—hallmarks of visceral adiposity.The liver acts as the first responder.
Mild elevations in ALT and GGT frequently indicate early hepatic fat deposition (NAFLD), reinforcing the close anatomical and metabolic link between visceral fat and liver dysfunction.Inflammation completes the triad.
Elevated hs-CRP reflects chronic low-grade inflammation driven by adipose-derived cytokines, bridging metabolic dysfunction with cardiovascular risk.Pattern recognition is superior to isolated values.
No single marker is definitive; the convergence of insulin resistance, dyslipidemia, and hepatic stress forms a recognizable and clinically actionable signature.The clinical implication is clear.
Routine blood work, when interpreted correctly, can identify high-risk individuals years before disease onset—transforming preventive medicine from reactive to proactive.The future of metabolic care lies in integration.
Combining biomarkers with clinical phenotyping and lifestyle data offers a scalable, cost-effective strategy to detect and reverse visceral fat–driven disease early.ApoB and Non-HDL Cholesterol — The Missing Risk Signal
ApoB reflects the total number of atherogenic particles (VLDL, IDL, LDL) and is more predictive of cardiovascular risk than LDL-C alone. In visceral adiposity, hepatic overproduction of VLDL increases ApoB-containing particles, making ApoB and non-HDL cholesterol superior markers of residual risk, even when traditional lipid values appear “normal.”
Fasting vs Postprandial Insulin — What You May Be Missing
Fasting insulin captures baseline insulin resistance, but postprandial insulin responses often reveal earlier metabolic dysfunction. Exaggerated insulin spikes after meals can precede fasting abnormalities, indicating early visceral fat–driven insulin resistance that routine fasting tests may underestimate.
Tracking Progress: What Changes First?
When you make targeted lifestyle changes, your blood markers do not all improve at the same rate. Understanding the timeline helps you stay motivated and avoid the trap of expecting everything to shift in weeks.
Weeks 2–4
Fasting insulin drops — the earliest and most sensitive signal of metabolic improvement. Triglycerides also begin to fall with carbohydrate reduction
.
Weeks 4–8
HOMA-IR and TyG index improve — reflecting combined glucose and insulin normalisation. ALT begins to fall if dietary fat intake and caloric surplus are addressed.
Months 2–4
TG/HDL ratio improves — HDL rises more slowly than triglycerides fall. hs-CRP begins to normalise as inflammatory adipokine release reduces
.
Months 4–6+
Adiponectin rises — a late but powerful marker of genuine visceral fat reduction. Full lipid profile, ApoB, and GGT normalise with sustained change.
Important Limitations to Keep in Mind
These markers are powerful screening tools — not definitive diagnoses. Several important caveats apply:
Ethnic variation matters significantly. South Asian populations develop visceral adiposity and insulin resistance at lower BMI thresholds and lower TG/HDL cut-offs than Western populations. Clinicians must apply ethnicity-adjusted reference ranges (Khan et al., 2024).
No single marker is sufficient. Pattern recognition across multiple markers is essential. Over-reliance on one value — even HOMA-IR — risks both false positives and false negatives.
Biological variability exists. Fasting conditions, recent illness, medications (corticosteroids, statins, antipsychotics), and acute stress all affect these values. Always interpret results in clinical context.
When imaging is still necessary: If clinical markers suggest high visceral fat burden but management decisions require quantification, hepatic ultrasound, FibroScan, or abdominal CT remains appropriate.
Practical Applications: What You Can Do Right Now
Request the right tests at your next check-up. Specifically ask your doctor for fasting insulin (not just glucose), a full lipid panel with triglycerides and HDL, and ALT. These are inexpensive and widely available.
Calculate your own TG/HDL ratio. Take your triglyceride value and divide it by your HDL. If the number exceeds 3.0 (or 2.0 if you are South Asian), discuss this with your clinician as a priority.
Use the TyG index when insulin is unavailable. Multiply your fasting triglycerides (mg/dL) by your fasting glucose (mg/dL), divide by 2, and take the natural logarithm. Online calculators make this simple.
Track trends, not just single values. These biomarkers are most powerful as a trend over time. Repeat testing every 3–6 months during an intervention allows you to see early metabolic improvements — often before any change on a scale.
Match your intervention to your marker profile. High TG/HDL responds fastest to reducing refined carbohydrates and increasing physical activity. Elevated ALT responds to weight loss and eliminating alcohol. High hs-CRP benefits from anti-inflammatory dietary patterns (Mediterranean diet).
Do not ignore a normal BMI with abnormal markers. The TOFI (Thin Outside, Fat Inside) phenotype is a real and serious condition. Metabolic markers are more important than the number on a scale.
Share results across your healthcare team. If you see a GP, endocrinologist, and dietitian, ensure all three have access to this full panel — metabolic risk assessment should be coordinated, not siloed.
Frequently Asked Questions
Can I have dangerous visceral fat even if my BMI is normal?
Yes — this is known as the TOFI (Thin Outside, Fat Inside) phenotype, or metabolically obese normal weight (MONW). Research consistently shows that individuals with normal BMI can harbour significant visceral adiposity. This is precisely why blood biomarkers are so valuable — they detect metabolic dysfunction regardless of body size or weight.
What is a healthy HOMA-IR value?
In most clinical guidelines, a HOMA-IR below 1.5 is considered optimal. Values between 1.5 and 2.5 suggest early insulin resistance, and values above 2.5 indicate significant insulin resistance. However, reference ranges differ by population — South Asian individuals may show metabolic abnormalities at lower cut-offs. Always interpret your result with your clinician, who knows your full clinical context.
Does a high TG/HDL ratio always mean I have visceral fat?
A high TG/HDL ratio is a strong signal of insulin resistance and atherogenic dyslipidemia — both strongly associated with visceral adiposity — but it is not a definitive diagnosis on its own. Secondary causes of hypertriglyceridaemia (hypothyroidism, heavy alcohol use, certain medications) must be excluded. The ratio is most informative when interpreted alongside fasting insulin, glucose, and liver enzymes as a complete metabolic picture.
How often should I repeat these tests?
If you are making active lifestyle changes, repeating the core panel (fasting glucose, fasting insulin, lipid profile, ALT) every 3 months allows you to see meaningful trends. For monitoring purposes without active intervention, annual testing is appropriate. Those with diagnosed metabolic syndrome or NAFLD may benefit from more frequent checks as determined by their clinician.
Is the TyG index better than HOMA-IR for detecting insulin resistance?
They perform comparably for predicting metabolic syndrome and insulin resistance in most population studies (Son et al., 2022). The key practical difference is access: HOMA-IR requires a fasting insulin measurement, which is not available at all labs or in all healthcare systems. The TyG index uses only fasting glucose and triglycerides — both available on a basic metabolic panel — making it more accessible in resource-limited settings without sacrificing meaningful predictive power.
What lifestyle changes most rapidly improve these blood markers?
The most evidence-backed interventions for rapidly improving visceral fat biomarkers are: (1) reducing refined carbohydrate and sugar intake, which lowers triglycerides and fasting insulin within 2–4 weeks; (2) increasing aerobic and resistance exercise, which dramatically improves insulin sensitivity; (3) achieving a modest caloric deficit — even 5–10% body weight loss produces significant improvement in ALT, HOMA-IR, and TG/HDL ratio; and (4) an anti-inflammatory dietary pattern (Mediterranean or whole-food-based) to address hs-CRP and inflammatory markers over 8–12 weeks.
Should I ask my doctor specifically for these tests, or are they routine?
A standard blood panel often includes fasting glucose, full lipid profile (giving you the TG/HDL ratio), and liver enzymes — but critically, fasting insulin is rarely ordered routinely. You will almost always need to specifically request fasting insulin to calculate HOMA-IR. Similarly, hs-CRP, GGT, and adiponectin are not part of most standard panels. Bring this guide to your appointment and discuss which tests are most appropriate for your specific risk profile.
Author’s Note: A Clinician’s Perspective
As a practicing physician, one of the most consistent patterns I encounter in clinical practice is the disconnect between outward appearance and internal metabolic health. Patients often present with a “normal” body weight and minimal visible adiposity, yet their laboratory profile tells a very different story—one of insulin resistance, atherogenic dyslipidemia, and early hepatic dysfunction. This paradox is not an exception; it is increasingly the norm, particularly in South Asian populations.
What has changed over the past decade is not just our understanding of visceral fat, but our ability to detect it early—without relying on expensive imaging. Routine blood tests, when interpreted through a metabolic lens, provide a powerful and underutilised diagnostic window into visceral adiposity. Markers such as fasting insulin, the HOMA-IR index, triglyceride-to-HDL ratio, and liver enzymes are not isolated data points; they are interconnected signals reflecting a shared pathophysiological process.
In my experience, the most critical clinical error is not missing advanced disease—it is overlooking early dysfunction. By the time fasting glucose rises or symptoms develop, metabolic damage is often well established. In contrast, subtle abnormalities in insulin dynamics and lipid patterns can identify high-risk individuals years earlier, when intervention is most effective and often fully reversible.
This article is written with a dual purpose: to help clinicians refine their interpretation of routine laboratory data, and to empower informed patients to engage more meaningfully with their metabolic health. The goal is simple but clinically profound—shift the focus from reactive disease management to early detection and prevention.
Related Articles
Visceral Fat Treatment: GLP-1, Semaglutide, and SGLT2 Explained
ApoB vs LDL Cholesterol: Which Is the Most Accurate Predictor of Heart Disease?
The #1 Diet Strategy to Reduce Visceral Fat According to Latest Research
Why Belly Fat Causes Insulin Resistance: Portal Theory Explained Simply
Obesity and Fatty Liver Disease: What Science Says About Risk and Health | DR T S DIDWAL
References
Baneu, P., Văcărescu, C., Drăgan, S.-R., Cirin, L., Lazăr-Höcher, A.-I., Cozgarea, A., Faur-Grigori, A.-A., Crișan, S., Gaiță, D., Luca, C.-T., & Cozma, D. (2024). The triglyceride/HDL ratio as a surrogate biomarker for insulin resistance. Biomedicines, 12(7), 1493. https://doi.org/10.3390/biomedicines12071493
Flores-Guerrero, J. L., Been, R. A., Shalaurova, I., Connelly, M. A., van Dijk, P. R., & Dullaart, R. P. F. (2024). Triglyceride/HDL cholesterol ratio and lipoprotein insulin resistance score: Associations with subclinical atherosclerosis and incident cardiovascular disease. Clinica Chimica Acta, 553, 117737. https://doi.org/10.1016/j.cca.2023.117737
Khan, K., Quazi, S., Bankar, N. J., Wanjari, A., Gosavi, R., Joshi, P., & Gupta, S. (2024). A cross-sectional observational study to assess the efficacy of triglyceride to high-density lipoprotein ratio as a marker of insulin resistance in subjects of Central Rural India. Cureus, 16(4), e58612. https://doi.org/10.7759/cureus.58612
Son, D.-H., Lee, H. S., Lee, Y.-J., Lee, J.-H., & Han, J.-H. (2022). Comparison of triglyceride-glucose index and HOMA-IR for predicting prevalence and incidence of metabolic syndrome. Nutrition, Metabolism and Cardiovascular Diseases, 32(3), 596–604. https://doi.org/10.1016/j.numecd.2021.10.015
Yuri, G., Santillana, N., Soto, L., Pereira, A., Corvalán, C., & Cifuentes, M. (2026). Association between metabolic and endocrine parameters with visceral adiposity index–defined adipose tissue dysfunction in young adult males. Journal of Obesity, 2026, 5233463. https://doi.org/10.1155/jobe/5233463
Zeng, P., Cai, X., Yu, X., Huang, L., & Chen, X. (2023a). HOMA-IR is an effective biomarker of non-alcoholic fatty liver disease in non-diabetic population. The Journal of International Medical Research, 51(10), 03000605231204462. https://doi.org/10.1177/03000605231204462
Zeng, P., Cai, X., Yu, X., et al. (2023b). Markers of insulin resistance associated with non-alcoholic fatty liver disease in non-diabetic population. Scientific Reports, 13, 20470. https://doi.org/10.1038/s41598-023-47269-4