Small Dense LDL vs Large LDL: Why Particle Size Matters More Than Your Cholesterol Number
Discover why small dense LDL particles are far more dangerous than standard LDL cholesterol. Learn how ApoB, LDL particle size, triglycerides, and advanced lipid testing predict heart disease risk better than LDL-C alone.
METABOLISM
Dr. T.S. Didwal, M.D.(Internal Medicine)
5/22/202623 min read
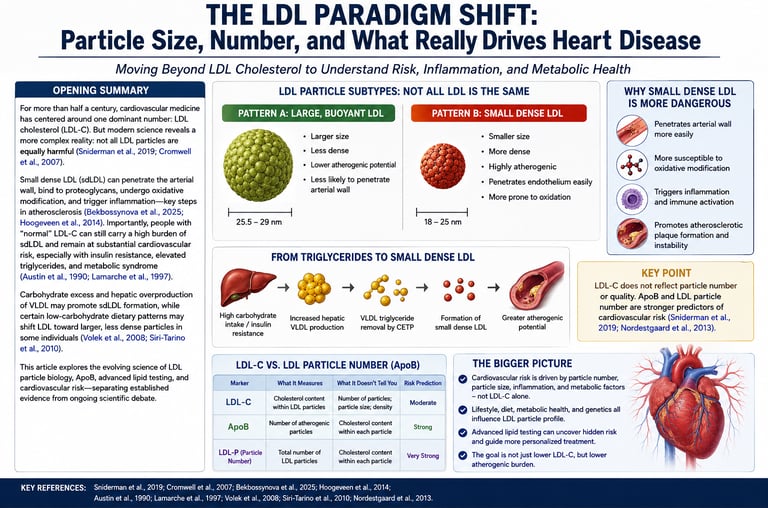
If your doctor says your LDL cholesterol is “a little high,” it’s natural to feel concerned. However, the standard LDL-C number from routine blood tests may not tell the full story about your heart disease risk. What truly matters is not just how much cholesterol your LDL particles carry, but their size, density, and number (Bekbossynova et al., 2025).
LDL particles exist on a spectrum. Pattern A consists of large, buoyant (“fluffy”) particles that are relatively harmless because they have difficulty entering artery walls. In contrast, Pattern B particles are small and dense. These tiny particles more easily penetrate the arterial lining, bind tightly to arterial tissue, and become oxidized, triggering inflammation and plaque formation (Zubiran et al., 2025). This makes small dense LDL far more atherogenic than large LDL, even when total LDL-C levels appear similar.
Conventional lipid panels measure only the cholesterol content inside LDL particles, not the number or quality of the particles themselves. This limitation can be misleading. A person with “normal” LDL-C on a high-carbohydrate diet may have many dangerous small dense particles, while someone on a low-carbohydrate, whole-food diet may show higher LDL-C carried mostly in safer, large particles.
Research consistently shows that particle size and number — best assessed through ApoB or NMR Lipoprofile testing — are stronger predictors of cardiovascular risk than LDL-C alone (Koba et al., 2024). Understanding this distinction empowers patients to move beyond fear of numbers and focus on improving LDL quality through diet and lifestyle choices.
Key Clinical Pearls
1. LDL particle size matters more than your total LDL cholesterol number.
Two people can have the same LDL-C level (e.g., 140 mg/dL), but one with mostly large, buoyant particles (Pattern A) has a much lower risk than someone with small, dense particles (Pattern B).
2. Small dense LDL (Pattern B) is far more dangerous.
These tiny, dense particles more easily penetrate artery walls, bind strongly to arterial tissue, and become oxidized — triggering the formation of dangerous atherosclerotic plaques.
3. High-carbohydrate diets promote harmful small dense LDL.
Excess carbs and sugars (especially refined ones and fructose) increase liver production of VLDL, which is converted into small dense LDL through the CETP and hepatic lipase pathway.
4. Saturated fat, in the right context, often improves LDL quality.
On a low-carbohydrate, whole-food diet, saturated fat tends to raise large, buoyant LDL particles (Pattern A) while keeping particle number and small dense LDL low — a much safer profile.
5. Standard lipid panels can be misleading.
A “normal” LDL-C with high triglycerides and low HDL often hides elevated small dense LDL. Use ApoB, NMR Lipoprofile, or the TG/HDL ratio for a clearer picture of true risk.
6. Advanced testing changes how we interpret high LDL.
If LDL-C rises on a low-carb or whole-food diet but triglycerides are low, HDL is high, and ApoB is not elevated, the increase is often benign (especially in lean, metabolically healthy people). Always test particle quality before treating the number.
What Experts Agree On
ApoB predicts risk strongly
sdLDL is associated with insulin resistance
elevated triglycerides worsen particle quality
What Remains Debated
independent causality of sdLDL
significance of isolated LDL elevation in LMHR
optimal treatment thresholds
1. The Fundamental Flaw in Standard Cholesterol Testing
When you get a routine lipid panel, your doctor receives four numbers: total cholesterol, HDL-C, triglycerides, and LDL-C. The LDL-C figure—LDL cholesterol—dominates the conversation and drives most treatment decisions.
But here's the problem: LDL-C measures the total mass of cholesterol molecules stuffed inside LDL particles. It tells you nothing about how many particles there are, how big they are, how dense they are, or how easily they can penetrate and damage your arterial walls.
Think of it this way. Imagine you are trying to assess the traffic risk on a highway. You could count the total weight of all the vehicles. Or you could count the number of vehicles and note what kind they are—motorcycles, sedans, SUVs, eighteen-wheelers. The second approach is obviously more informative. The weight measurement tells you almost nothing about accident risk.
LDL-C is the "total weight" measurement. What you actually need to know is the particle count, the particle size, and the particle type.
Why This Distinction Has Enormous Clinical Consequences
Two patients can have identical LDL-C levels—say, 140 mg/dL—yet have vastly different cardiovascular risk profiles depending on whether that cholesterol is carried in a relatively small number of large, buoyant particles, or a large number of small, dense, arterogenic particles.
As a 2025 review in Molecular Medicine Reports highlights, small dense LDL has emerged as an underestimated and critically important driver of atherosclerosis—independent of total LDL-C—because of its unique structural and biophysical properties that make it far more likely to invade and damage arterial tissue. (Bekbossynova et al., 2025)
Key Takeaway: LDL-C measures cholesterol mass, not particle risk. Two people with the same LDL-C can have dramatically different cardiovascular risk based on the size and density of their LDL particles.
2. The LDL Particle Spectrum: Pattern A vs. Pattern B
LDL particles are not a uniform population. They exist on a biophysical spectrum defined by size, density, and composition. Scientists have broadly classified these into two phenotypes:
Pattern A: Large, Buoyant LDL (The "Fluffy" Profile)
Particle diameter: Greater than 25.5 nanometers
Density: Lower (more lipid-rich relative to protein)
Cholesterol content per particle: Higher
Atherogenic potential: Lower
Common association: Higher HDL-C, lower triglycerides, metabolically healthier profile
Large, buoyant LDL particles are sometimes colloquially called "fluffy" LDL. They are large enough that they have difficulty penetrating the arterial endothelium, and they carry relatively more antioxidant protection (primarily Vitamin E), which reduces their susceptibility to oxidative modification.
Pattern B: Small, Dense LDL (The Dangerous Profile)
Particle diameter: Less than 25.5 nanometers (often as small as 18–21 nm)
Density: Higher (protein-rich relative to lipid)
Cholesterol content per particle: Lower
Atherogenic potential: Dramatically higher
Common association: Lower HDL-C, higher triglycerides, insulin resistance, metabolic syndrome
Small dense LDL particles are the villains of lipid biology. Their small size, altered surface composition, and lack of antioxidant protection make them extraordinarily capable of infiltrating arterial walls, binding to the tissue matrix, and undergoing the oxidative modifications that spark full-blown atherosclerosis.
A Spectrum, Not a Binary
It is important to understand that Pattern A and Pattern B represent ends of a continuous spectrum. Most individuals have a mixture of particle sizes, and the phenotype designation refers to which type predominates. Some researchers recognize intermediate subfractions (Pattern I) as well.
3. How Saturated Fat Shapes Your LDL Architecture
One of the most persistent myths in nutrition science is the idea that saturated fat is simply "bad" because it raises LDL cholesterol. The reality is far more nuanced—and far more interesting.
The Hepatic LDL Receptor: Where Saturated Fat Acts
To understand the relationship between dietary saturated fat and LDL particle size, you need to understand the LDL receptor (LDLR) on liver cells (hepatocytes). This receptor is responsible for clearing LDL particles from circulation by binding to them and pulling them into the liver cell for processing.
Certain saturated fatty acids—particularly lauric acid (C12), myristic acid (C14), and palmitic acid (C16)—modestly downregulate the expression of hepatic LDLR. When LDLR activity decreases, LDL particles circulate for longer before being cleared.
Here is the critical insight: the particles that remain in circulation longest are the large, buoyant LDL particles, because small dense LDL is actually cleared through alternative, less efficient pathways. When saturated fat mildly suppresses LDLR activity in someone eating a whole-food, low-carbohydrate diet, the predominant effect is an increase in the residence time of large, buoyant LDL.
Why This Shifts You Toward Pattern A
In the context of a low-carbohydrate, whole-food diet:
Hepatic VLDL production is low (because carbohydrate intake—the primary driver of VLDL synthesis—is reduced)
Triglycerides are low
LDLR is modestly downregulated by saturated fatty acids
Large, buoyant LDL particles accumulate in circulation
The net result: LDL-C rises, but particle number may stay the same or decrease, and the particles that are present are predominantly large and buoyant. This is a Pattern A profile—the benign scenario.
This is why many individuals who adopt a low-carbohydrate or ketogenic diet experience an increase in LDL-C that alarms their physician—but when properly evaluated with ApoB or NMR testing, may show no increase (or even a decrease) in atherogenic particle burden.
Not All Saturated Fats Are Equal
It is worth noting that:
Stearic acid (C18), found abundantly in beef tallow and dark chocolate, does not downregulate LDLR and has a neutral effect on LDL-C
Short-chain saturated fats (butyrate, C4; caproic acid, C6) are largely burned as fuel and have minimal effects on lipoprotein metabolism
Palmitic acid (C16) and myristic acid (C14) have the most pronounced—though still modest—effects on LDLR downregulation
4. How High-Carbohydrate Diets Generate Dangerous Small Dense LDL
The relationship between dietary carbohydrates—particularly refined carbohydrates and added sugars—and small dense LDL is one of the most important and underappreciated stories in cardiovascular nutrition.
The VLDL-to-sdLDL Cascade
Here is the metabolic pathway, step by step:
Step 1 — Excess carbohydrate intake When you consume more carbohydrates than you can immediately use for energy, the surplus is converted to fat (de novo lipogenesis) in the liver. The primary product of this process is palmitate (C16:0), which is packaged into triglyceride-rich VLDL particles and exported into the bloodstream.
Step 2 — High circulating VLDL The more carbohydrates you eat (especially fructose, which drives hepatic de novo lipogenesis particularly aggressively), the more VLDL your liver produces, and the higher your blood triglycerides climb.
Step 3 — Cholesterol ester transfer protein (CETP) activity An enzyme called CETP transfers triglycerides from VLDL into LDL particles, replacing cholesterol esters in LDL. This makes LDL particles progressively more triglyceride-rich and cholesterol-poor.
Step 4 — Hepatic lipase acts on triglyceride-enriched LDL Hepatic lipase strips the triglycerides from these modified LDL particles, leaving behind small, dense, cholesterol-depleted remnants.
The end product: Small dense LDL.
This is why high-carbohydrate, low-fat diets—particularly those high in refined carbohydrates—are so reliably associated with Pattern B phenotype and elevated triglycerides, even when LDL-C appears normal or even lower than average.
The Paradox of "Normal" LDL-C on a High-Carb Diet
Here is where the standard lipid panel fails most dramatically:
A patient eating a high-carbohydrate, low-fat diet may present with:
LDL-C: 110 mg/dL (appears reassuringly normal)
Triglycerides: 250 mg/dL (elevated)
HDL-C: 38 mg/dL (low)
This pattern—often called the "atherogenic dyslipidemia" triad or "lipid triad"—is strongly associated with insulin resistance and dramatically elevated cardiovascular risk. But because LDL-C looks fine, it may be dismissed. The actual LDL particle count and the proportion of small dense particles can be dangerously elevated.
5. The Biophysics of Plaque: Why Small Dense LDL Is So Deadly
Understanding why small dense LDL is so atherogenic requires a brief dive into vascular biology. Three interconnected mechanisms explain the exceptional danger of Pattern B particles.
Mechanism 1: Endothelial Penetration
The endothelium—the single-cell-thick lining of your blood vessels—is not a rigid wall. It is a dynamic, selectively permeable barrier. Even in healthy people, LDL particles can transiently enter the sub-endothelial space. Whether they stay there and cause damage is the key question.
Small dense LDL particles penetrate the compromised endothelium far more easily than large, buoyant particles, for two reasons:
Physical size advantage: At 18–21 nm in diameter, sdLDL is small enough to slip through intercellular junctions in the endothelium, especially where the endothelium is already mildly dysfunctional (as occurs with hypertension, chronic inflammation, or oxidative stress).
Reduced electrostatic repulsion: The surface charge of sdLDL differs from large LDL, reducing the electrostatic forces that normally repel LDL from the negatively charged endothelial surface.
Once in the sub-endothelial space (the intima), the real damage begins.
Mechanism 2: Proteoglycan Binding ("Velcro Effect")
The intima contains a matrix of structural proteins called proteoglycans—most notably biglycan and decorin. These proteoglycans carry highly negative charge and act like molecular velcro for LDL particles.
Small dense LDL binds to arterial proteoglycans with much greater affinity than large, buoyant LDL. This is because:
The surface of sdLDL has a higher proportion of apolipoprotein B-100 (ApoB-100) exposed in a conformation that allows tighter binding to proteoglycan chains
Large LDL, by contrast, tends to pass through the intima and re-enter circulation before becoming permanently entrapped
Once bound to proteoglycans, an LDL particle is essentially immobilized in the arterial wall. Now it's vulnerable to the most critical event in the atherosclerotic cascade.
Mechanism 3: Oxidative Susceptibility — The Spark That Ignites Atherosclerosis
This is perhaps the most important mechanism, and the one that most clearly explains why sdLDL is so dangerous.
LDL must be oxidized to become truly atherogenic. Native (unmodified) LDL is poorly recognized by macrophage scavenger receptors. But oxidized LDL (oxLDL) is voraciously consumed by macrophages, leading to foam cell formation—the hallmark of early atherosclerotic plaques.
Small dense LDL is dramatically more susceptible to oxidation than large LDL, because:
Lower Vitamin E content: Vitamin E (alpha-tocopherol) is the primary antioxidant carried within LDL particles. sdLDL particles contain significantly less Vitamin E per particle than large LDL, leaving them poorly protected against free radical attack.
Longer residence time in the intima: Because sdLDL is trapped by proteoglycans, it sits in the pro-oxidant environment of the arterial wall for longer, increasing cumulative oxidative exposure.
Higher proportion of polyunsaturated fatty acids (PUFAs) in the core: The lipid core of sdLDL contains a higher proportion of oxidation-prone PUFAs, providing more substrate for lipid peroxidation chain reactions.
The cascade of events
sdLDL enters the arterial wall (intima) Binds tightly to arterial proteoglycans Undergoes oxidative modification (oxLDL formation) ,Macrophages recognize and engulf oxLDL
Macrophages become cholesterol-filled foam cells Foam cells accumulate and eventually die
Dead cells release lipids and inflammatory debris ,Necrotic core develops within the artery wall ,
Fibrous cap forms over the lesion
Atherosclerotic plaque becomes established
According to a 2025 study in Arteriosclerosis, Thrombosis, and Vascular Biology that analyzed data from the large UK Biobank cohort, estimated small dense LDL cholesterol was significantly and independently associated with atherosclerotic cardiovascular disease risk—an association that was not captured by standard LDL-C measurement alone. (Zubiran et al., 2025)
6. Advanced Testing: ApoB, NMR Lipoprofile, and sdLDL-C Direct Measurement
Now that you understand why LDL particle quality matters, the obvious question is: how do you actually measure it? Several validated approaches are now available.
Test 1: Apolipoprotein B (ApoB)
What it measures: Each and every LDL particle (as well as VLDL, IDL, and Lp(a)) carries exactly one molecule of ApoB-100 protein. Therefore, ApoB concentration directly reflects the total number of atherogenic particles in circulation.
Why it's superior to LDL-C:
ApoB captures particle number, not cholesterol mass
It accounts for both LDL and other atherogenic particles
In numerous large studies, ApoB outperforms LDL-C as a predictor of cardiovascular events, particularly in patients with hypertriglyceridemia or metabolic syndrome
Optimal targets:
Risk Category Desirable ApoB Low cardiovascular risk < 100 mg/dL Moderate cardiovascular risk < 80 mg/dL High cardiovascular risk < 70 mg/dL Very high risk (established ASCVD) < 60 mg/dL
Practical note: ApoB testing is widely available, inexpensive, and covered by most insurance plans. There is no excuse for not including it in routine cardiovascular screening.
Test 2: NMR Lipoprofile (Nuclear Magnetic Resonance Spectroscopy)
What it measures: NMR technology physically separates and counts LDL particles by size. It reports:
LDL-P (LDL particle number): Total count of LDL particles
Small LDL-P: Number of small dense LDL particles specifically
Large LDL-P: Number of large LDL particles
Mean LDL particle size: Average diameter in nanometers
HDL-P and VLDL-P as well
Why it matters clinically: NMR data allow you to identify patients with "discordant" lipid profiles—those where LDL-C and LDL-P give different risk signals. Research consistently shows that when LDL-C and LDL-P are discordant, LDL-P is the stronger predictor of cardiovascular events.
Pattern B diagnosis via NMR:
Mean LDL particle size < 20.5 nm: Pattern B (high risk)
Mean LDL particle size > 20.5 nm: Pattern A (lower risk)
Test 3: Direct sdLDL-C Measurement
An emerging and increasingly important option is the direct measurement of small dense LDL cholesterol (sdLDL-C) using homogeneous assay methods. This is now commercially available and clinically validated.
A landmark 2024 study published in Clinical Chemistry followed patients with stable coronary artery disease over the long term. The researchers found that direct measurement of sdLDL-C was a significantly better predictor of major adverse cardiac events (MACE) than LDL-C, even in patients already on statin therapy. The investigators concluded that sdLDL-C measurement should be incorporated into secondary prevention protocols. (Koba et al., 2024)
Test 4: Triglyceride/HDL-C Ratio
While not a particle-level test, the triglyceride-to-HDL ratio is a useful, free surrogate for sdLDL prevalence, because small dense LDL production is so tightly linked to elevated triglycerides and low HDL:
TG/HDL Ratio Implication < 2.0 Pattern A likely (lower risk) 2.0 – 3.5 Mixed phenotype, borderline > 3.5 Pattern B likely (higher risk)
(These thresholds apply when both TG and HDL are measured in mg/dL. Adjust if using mmol/L.)
7. Interpreting an Isolated LDL-C Rise on a Whole-Food Diet
This scenario is increasingly common in clinical practice: a patient adopts a whole-food, animal-based, or low-carbohydrate diet, returns for a follow-up lipid panel, and their LDL-C has risen from 110 to 160 mg/dL. The patient is alarmed. The physician reaches for the prescription pad.
But is this rise always cause for concern? Not necessarily.
The "Lean Mass Hyper-Responder" Phenomenon
A subset of individuals—often lean, metabolically healthy, and physically active—show dramatic rises in LDL-C on low-carbohydrate diets (sometimes exceeding 200 mg/dL). Cardiovascular researcher Dave Feldman has called these individuals "Lean Mass Hyper-Responders" (LMHR), and emerging research suggests their elevated LDL-C may be a physiological adaptation related to fat metabolism in lean individuals, not a pathological signal.
Critically, LMHR individuals typically show:
Very low triglycerides (often < 70 mg/dL)
High HDL-C (often > 70 mg/dL)
Normal or low ApoB
Large, buoyant LDL particles (Pattern A)
The 3-Step Clinical Response Protocol
When you (or your patient) presents with an isolated rise in LDL-C on a whole-food diet:
Step 1 — Don't panic based on LDL-C alone. It is an incomplete marker.
Step 2 — Obtain a complete metabolic context:
Fasting triglycerides
HDL-C
Fasting glucose and insulin (HOMA-IR)
ApoB (strongly recommended)
hsCRP (high-sensitivity C-reactive protein) as an inflammatory marker
Lp(a) (lipoprotein a, a genetic risk factor)
Step 3 — Apply the risk hierarchy:
High LDL-C + Low Triglycerides + High HDL + Low ApoB + Low hsCRP
→ Suggests predominantly large, buoyant LDL (Pattern A) with lower relative cardiovascular risk; monitor and assess overall metabolic health.High LDL-C + High Triglycerides + Low HDL + High ApoB + High hsCRP
→ Suggests atherogenic dyslipidemia with increased small dense LDL burden and elevated cardiovascular risk; warrants further evaluation and treatment.High LDL-C + Elevated Lp(a)
→ Indicates a significant independent genetic cardiovascular risk factor; often requires more aggressive risk reduction regardless of LDL particle size.A 2026 publication in Current Atherosclerosis Reports provides updated methods for calculating LDL-C fractions and related biomarkers that may help refine this clinical decision-making process. (Wolska et al., 2026)
Safety Warning: This three-step framework is a clinical educational tool, not a substitute for individualized medical evaluation. Patients with a personal or family history of premature cardiovascular disease, established ASCVD, or familial hypercholesterolemia should always be evaluated by a cardiologist before making decisions about lipid management.
8. Evidence Summary: Key Studies on LDL Particle Size and Cardiovascular Risk
Zubiran et al. (ATVB, UK Biobank, 2025)
→ Estimated small dense LDL-C (sdLDL-C) was independently associated with ASCVD risk, even after accounting for standard LDL-C levels.Koba et al. (Clinical Chemistry, 2024)
→ Direct sdLDL-C measurement predicted long-term major adverse cardiac events (MACE) more accurately than LDL-C in patients with stable coronary artery disease on statin therapy.Bekbossynova et al. (Molecular Medicine Reports, 2025)
→ Comprehensive review identified sdLDL as a major underestimated driver of atherosclerosis through oxidative stress, endothelial penetration, and inflammatory mechanisms.Wolska et al. (Current Atherosclerosis Reports, 2026)
→ Developed newer computational methods for estimating sdLDL-C and related lipid biomarkers, improving access to particle-level cardiovascular risk assessment.American Journal of Physiology – Heart and Circulatory Physiology (2024)
→ Provided mechanistic evidence showing that LDL particle size and quality influence vascular biology and atherosclerotic processes differently.Multiple Meta-Analyses Comparing ApoB vs LDL-C (2015–2024)
→ Consistently demonstrated that ApoB is a stronger predictor of cardiovascular events than LDL-C, especially in insulin resistance and metabolic syndrome.
Study Limitation Note: Much of the existing data on sdLDL and cardiovascular risk is observational. While mechanistic studies strongly support the causal role of sdLDL in atherogenesis, large-scale randomized controlled trials specifically targeting sdLDL reduction (independent of LDL-C) are still relatively limited. Clinicians should interpret the evidence in the context of the full patient picture.
9. Common Myths and Dangerous Mistakes About LDL
Myth 1: "High LDL is Always Dangerous"
The truth: High LDL-C in the context of large, buoyant particles, low triglycerides, high HDL, and low ApoB represents a very different risk than high LDL-C with small dense particles. Context is everything.
Myth 2: "Low LDL Means You're Safe"
The truth: You can have a "normal" or even low LDL-C of 90 mg/dL and still have a high particle count of predominantly small dense LDL, particularly if your triglycerides are high and HDL is low. This is the atherogenic dyslipidemia pattern—and it can be missed entirely by standard testing.
Myth 3: "Saturated Fat Causes Heart Disease by Raising LDL"
The truth: Saturated fat raises LDL-C primarily by increasing large, buoyant LDL particles—a Pattern A shift. The relevant question is not whether LDL-C goes up, but whether the atherogenic particle burden (ApoB, sdLDL) increases. In many cases, particularly on a whole-food low-carbohydrate diet, it does not.
Myth 4: "The Triglyceride/HDL Ratio Is Just for Insulin Resistance"
The truth: While the TG/HDL ratio is indeed strongly associated with insulin resistance, it is also a clinically validated surrogate marker for small dense LDL predominance and carries independent cardiovascular predictive value.
Myth 5: "You Only Need to Check LDL Particle Size If You Have Symptoms"
The truth: Atherosclerosis is a decades-long, largely silent process. By the time symptoms appear, significant plaque burden is often already present. Proactive particle-level testing is most valuable precisely in asymptomatic individuals who appear "fine" on standard testing.
Mistake: Dismissing Elevated LDL-C on a Whole-Food Diet Without Further Testing
This is perhaps the most clinically consequential error. When a patient on a low-carbohydrate or whole-food diet presents with elevated LDL-C and normal triglycerides, dismissing it or aggressively treating it without further workup are both potentially wrong. The correct response is ApoB and/or NMR testing to determine the actual particle-level situation.
10. Practical Action Plan: Optimizing Your LDL Particle Profile
Dietary Strategies to Reduce Small Dense LDL
✅ Do More Of:
Whole-food animal proteins and fats (eggs, meat, fish, dairy from pasture-raised animals)
Non-starchy vegetables (maximises fibre, antioxidants, and micronutrients)
Olive oil and avocados (oleic acid supports large LDL particle formation)
Fatty fish high in omega-3s (EPA and DHA reduce VLDL production and triglycerides)
Nuts and seeds in moderation (mixed evidence, but generally neutral to beneficial for particle profile)
❌ Reduce or Eliminate:
Refined carbohydrates and added sugars (the primary dietary driver of Pattern B)
Fructose-sweetened beverages (soft drinks, juices) — particularly potent drivers of hepatic de novo lipogenesis
Ultra-processed foods (typically high in refined carbs, industrial seed oils, and trans fats)
Excess alcohol (elevates triglycerides and drives VLDL production)
Lifestyle Interventions
Resistance training (2–4 sessions/week)
→ Reduces small dense LDL (sdLDL), improves insulin sensitivity, and lowers triglyceride levels.Aerobic exercise (150+ minutes/week)
→ Increases HDL cholesterol, reduces triglycerides, and promotes a shift toward the less atherogenic Pattern A LDL profile.Weight loss (in overweight individuals)
→ Significantly decreases sdLDL levels and improves the overall lipid and metabolic profile.Sleep optimization (7–9 hours/night)
→ Helps reduce insulin resistance and prevents triglyceride elevation associated with chronic sleep deprivation.Stress management
→ Reduces chronic cortisol elevation, which can otherwise increase triglycerides and worsen LDL particle quality.
A Practical 30-Day Cholesterol Quality Protocol
Week 1–2: Foundation
Eliminate all sugar-sweetened beverages and fruit juices
Reduce refined carbohydrate intake to under 100g/day (or lower if insulin resistant)
Add one serving of fatty fish (salmon, sardines, mackerel) at least 3×/week
Week 3–4: Optimization
Incorporate 3–4 sessions of strength training per week
Add 30 minutes of walking after meals (reduces postprandial triglyceride spikes)
Ensure 7–9 hours of quality sleep nightly
At 6–8 Weeks: Re-test
Obtain a full lipid panel including triglycerides and HDL-C
Request ApoB
Calculate TG/HDL ratio
Consider NMR Lipoprofile if results are ambiguous
11. Frequently Asked Questions
Q1: What is the difference between LDL-C and LDL-P?
LDL-C is the total mass of cholesterol molecules inside all LDL particles. LDL-P (LDL particle number) is the actual count of LDL particles, measured by NMR spectroscopy. LDL-P is generally a better predictor of cardiovascular risk than LDL-C, particularly when the two are discordant. A patient can have high LDL-C but low LDL-P (Pattern A, lower risk) or low LDL-C but high LDL-P (Pattern B, higher risk).
Q2: Does saturated fat cause small dense LDL?
No—this is a common misconception. Dietary saturated fat, in the context of a whole-food, low-carbohydrate diet, actually tends to shift LDL particles toward the larger, more buoyant Pattern A profile. Small dense LDL is predominantly generated by high carbohydrate intake—particularly refined carbohydrates and added sugars—through the hepatic VLDL-to-sdLDL metabolic cascade.
Q3: Is ApoB the best single test for cardiovascular risk assessment?
ApoB is arguably the strongest single blood-based marker for atherogenic particle burden and outperforms LDL-C in numerous large prospective studies. However, it should ideally be interpreted alongside other factors including Lp(a), hsCRP, triglycerides, HDL-C, blood pressure, HbA1c, family history, and imaging studies (e.g., coronary artery calcium score). No single number tells the whole story.
Q4: What triglyceride level indicates Pattern B?
Fasting triglycerides above approximately 130–150 mg/dL are associated with an increased likelihood of Pattern B (small dense LDL predominance). The TG/HDL ratio above 3.5 (in mg/dL units) is a strong surrogate indicator of sdLDL predominance. Importantly, these thresholds are guidelines, not absolute cutoffs—individual variation exists.
Q5: Can statins reduce small dense LDL?
Statins primarily reduce LDL-C by upregulating hepatic LDL receptors, which increases clearance of LDL particles—including sdLDL. High-intensity statin therapy does reduce sdLDL-C. However, the 2024 study by Koba and colleagues found that even in patients optimally managed with statins, residual sdLDL-C remained an independent predictor of outcomes—suggesting that monitoring sdLDL adds clinical value even in treated patients. (Koba et al., 2024)
Q6: Does the ketogenic diet always cause Pattern A?
Not universally. While many individuals on ketogenic or low-carbohydrate diets shift toward Pattern A, a subset—particularly those who are lean with high energy needs—may show very large LDL-C rises with variable particle profiles. This is why ApoB or NMR testing is essential for anyone on a carbohydrate-restricted diet who shows a significant LDL-C increase. The answer must be individualized.
Q7: What is the optimal ApoB level?
For individuals without established cardiovascular disease and low baseline risk, an ApoB below 90–100 mg/dL is generally considered acceptable. For individuals with moderate risk, below 80 mg/dL is preferable. For those with established ASCVD or high-risk features, below 60–70 mg/dL is the emerging target based on recent guidelines and outcomes data.
Q8: Is the NMR Lipoprofile test widely available?
In the United States, NMR Lipoprofile testing is available through LabCorp (LipoScience NMR platform) and some specialty cardiovascular labs. Availability varies internationally. ApoB testing is more universally accessible and serves as an excellent and cost-effective alternative for particle number assessment.
Q9: Can I estimate my sdLDL from standard labs?
Researchers have developed validated equations to estimate sdLDL-C from standard lipid panels—using triglycerides, total cholesterol, HDL-C, and LDL-C as inputs. A 2026 paper by Wolska and colleagues in Current Atherosclerosis Reports reviewed new computational methods for calculating sdLDL-C and related biomarkers, some of which can be applied to routine lab data. While estimated sdLDL-C is not a substitute for direct measurement or NMR, it provides useful clinical information from tests your patient has already had. (Wolska et al., 2026)
Q10: Does high LDL on a carnivore or whole-food diet require medication?
This is one of the most clinically nuanced questions in modern lipid management. The answer depends entirely on the type of LDL elevation. If ApoB is low-to-normal and particle size is predominantly large (Pattern A), medication may not be warranted based on current evidence. If ApoB is elevated, Lp(a) is high, or there is a family history of premature coronary artery disease, a more aggressive approach may be appropriate. This decision must be made in consultation with a physician or cardiologist who is familiar with particle-level testing and low-carbohydrate nutrition physiology.
Q11: What role does Lp(a) play in this picture?
Lipoprotein(a) [Lp(a)] is a separate, genetically determined lipoprotein that carries its own atherogenic burden independent of LDL-C and particle size. Elevated Lp(a) (above 50 mg/dL or 125 nmol/L) confers significant cardiovascular risk that is not captured by LDL-C, ApoB, or NMR Lipoprofile. It should be measured at least once in all adults, particularly those with a family history of premature heart disease. Lp(a) is largely unresponsive to dietary intervention; targeted therapies are in late-stage clinical trials.
Q12: How often should I test my LDL particle profile?
For low-risk individuals making lifestyle changes, retesting 8–12 weeks after dietary or exercise modifications is generally sufficient to see meaningful changes in the lipid profile. For individuals being monitored for established cardiovascular disease or on lipid-lowering therapy, every 3–6 months may be appropriate in collaboration with your physician. Annual or biannual testing is reasonable for metabolically stable, low-risk individuals.
12. Conclusion and Clinical Action Steps
A Clinician’s Perspective on LDL Particle Size, ApoB, and Cardiovascular Risk
From a modern preventive cardiology perspective, relying solely on LDL-C to assess cardiovascular risk is increasingly inadequate. Standard LDL cholesterol testing measures the amount of cholesterol carried within LDL particles, but it does not reveal the number of atherogenic particles, their size, density, or biological behavior. As a result, conventional lipid panels may underestimate risk in patients with insulin resistance, elevated triglycerides, metabolic syndrome, or predominance of small dense LDL (sdLDL).
Current evidence suggests that ApoB, LDL particle number (LDL-P), and sdLDL-C provide a more accurate assessment of atherosclerotic cardiovascular disease (ASCVD) risk than LDL-C alone. Small dense LDL particles are particularly concerning because they penetrate the arterial wall more easily, bind more strongly to vascular proteoglycans, remain trapped within the arterial intima, and undergo oxidative modification that accelerates foam cell formation and plaque development.
Importantly, cardiovascular risk assessment should always be interpreted within the broader metabolic context. Elevated LDL-C accompanied by low triglycerides, high HDL-C, low inflammatory markers, and favorable ApoB levels may represent a metabolically healthier Pattern A phenotype. In contrast, elevated triglycerides, low HDL, insulin resistance, high ApoB, and systemic inflammation are more strongly associated with the atherogenic Pattern B profile and increased ASCVD risk.
Emerging research also highlights the important role of diet quality and metabolic health. Diets high in refined carbohydrates and excess sugars promote hepatic VLDL overproduction and small dense LDL formation, whereas whole-food dietary patterns that improve insulin sensitivity may favorably influence LDL particle characteristics in some individuals.
Clinical Action Steps for Patients and Practitioners
Request ApoB testing alongside a standard lipid panel for improved cardiovascular risk assessment.
Evaluate the triglyceride-to-HDL ratio, a useful surrogate marker of insulin resistance and sdLDL predominance.
Consider NMR Lipoprofile or direct sdLDL-C testing in patients with discordant lipid profiles or metabolic syndrome.
Measure Lp(a) at least once in adulthood to identify genetically elevated cardiovascular risk.
Address the root metabolic drivers of atherogenic dyslipidemia through:
reduction of refined carbohydrates and ultra-processed foods,
regular aerobic and resistance exercise,
weight optimization,
sleep improvement,
and insulin resistance management.
Ultimately, the goal of lipid management is not merely achieving a lower LDL-C number—it is reducing cumulative arterial injury, inflammation, and atherosclerotic plaque formation. Understanding LDL particle biology allows clinicians and patients to move beyond oversimplified cholesterol metrics toward a more precise and personalized model of cardiovascular prevention.
Disclaimer: This article is for informational purposes only and does not constitute medical advice. Individual circumstances vary, and treatment decisions should always be made in consultation with qualified healthcare professionals.
Related Articles
De Novo Lipogenesis Explained: How Sugar Turns Into Liver Fat and High Triglycerides
Rethinking Dietary Fats: What New Research Reveals About Plant vs. Animal Fats | DR T S DIDWAL
What’s New in the 2025 Blood Pressure Guidelines? A Complete Scientific Breakdown | DR T S DIDWAL
Low-Fat vs. Low-Carb: Which Diet is Best for Weight Loss? | DR T S DIDWAL
5 Steps to Reverse Metabolic Syndrome: Diet, Habit, & Lifestyle Plan | DR T S DIDWAL
The Role of Cholesterol in Health and Disease: Beyond the "Bad" Label | DR T S DIDWAL
Lowering Cholesterol with Food: 4 Phases of Dietary Dyslipidemia Treatment | DR T S DIDWAL
References
American Journal of Physiology — Heart and Circulatory Physiology. (2024). Vascular physiology and LDL particle quality. https://journals.physiology.org/doi/full/10.1152/ajpheart.00332.2024
Austin, M. A., King, M. C., Vranizan, K. M., & Krauss, R. M. (1990). Atherogenic lipoprotein phenotype: A proposed genetic marker for coronary heart disease risk. Circulation, 82(2), 495–506. https://doi.org/10.1161/01.CIR.82.2.495
Bekbossynova, M., Saliev, T., Ivanova-Razumova, T., Andossova, S., Kali, A., & Myrzakhmetova, G. (2025). Small dense LDL: An underestimated driver of atherosclerosis (Review). Molecular Medicine Reports, 32, Article 328. https://doi.org/10.3892/mmr.2025.13693
Berneis, K. K., & Krauss, R. M. (2002). Metabolic origins and clinical significance of LDL heterogeneity. Journal of Lipid Research, 43(9), 1363–1379. https://doi.org/10.1194/jlr.R200004-JLR2000
Bhatt, D. L., Steg, P. G., Miller, M., Brinton, E. A., Jacobson, T. A., Ketchum, S. B., Doyle, R. T., Jr., Juliano, R. A., Jiao, L., Granowitz, C., Tardif, J. C., & Ballantyne, C. M. (2019). Cardiovascular risk reduction with icosapentaenoic acid for hypertriglyceridemia. New England Journal of Medicine, 380(1), 11–22. https://doi.org/10.1056/NEJMoa1812741
Cromwell, W. C., Otvos, J. D., Keyes, M. J., Pencina, M. J., Sullivan, L., Vasan, R. S., Wilson, P. W. F., & D'Agostino, R. B. (2007). LDL particle number and risk of future cardiovascular disease in the Framingham Offspring Study — implications for LDL management. Journal of Clinical Lipidology, 1(6), 583–592. https://doi.org/10.1016/j.jacl.2007.10.001
Dreon, D. M., Fernstrom, H. A., Campos, H., Blanche, P., Williams, P. T., & Krauss, R. M. (1998). Change in dietary saturated fat intake is correlated with change in mass of large low-density-lipoprotein particles in men. American Journal of Clinical Nutrition, 67(5), 828–836. https://doi.org/10.1093/ajcn/67.5.828
Freedman, D. S., Otvos, J. D., Jeyarajah, E. J., Shalaurova, I., Cupples, L. A., Parise, H., D'Agostino, R. B., Wilson, P. W., & Schaefer, E. J. (2004). Sex and age differences in lipoprotein subclasses measured by nuclear magnetic resonance spectroscopy: The Framingham Study. Clinical Chemistry, 50(7), 1189–1200. https://doi.org/10.1373/clinchem.2004.032599
Hoogeveen, R. C., Gaubatz, J. W., Sun, W., Dodge, R. C., Crosby, J. R., Jiang, J., Couper, D., Virani, S. S., Kathiresan, S., Boerwinkle, E., & Ballantyne, C. M. (2014). Small dense low-density lipoprotein–cholesterol concentrations predict risk for coronary heart disease: The Atherosclerosis Risk in Communities (ARIC) Study. Arteriosclerosis, Thrombosis, and Vascular Biology, 34(5), 1069–1077. https://doi.org/10.1161/ATVBAHA.114.303284
Journal of Clinical Lipidology. (2024). Small dense LDL and cardiovascular outcomes — mechanistic review. https://www.sciencedirect.com/science/article/pii/S2772374725002893
Koba, S., Satoh, N., Ito, Y., Yokota, Y., Tsunoda, F., Sakai, K., Nakamura, Y., Shoji, M., Hirano, T., & Shinke, T. (2024). Impact of direct measurement of small dense low-density lipoprotein cholesterol for long-term secondary prevention in patients with stable coronary artery disease. Clinical Chemistry, 70(7), 957–966. https://doi.org/10.1093/clinchem/hvae061
Lamarche, B., Tchernof, A., Moorjani, S., Cantin, B., Dagenais, G. R., Lupien, P. J., & Després, J. P. (1997). Small, dense low-density lipoprotein particles as a predictor of the risk of ischemic heart disease in men. Circulation, 95(1), 69–75. https://doi.org/10.1161/01.CIR.95.1.69
Packard, C. J., & Shepherd, J. (1997). Lipoprotein heterogeneity and apolipoprotein B metabolism. Arteriosclerosis, Thrombosis, and Vascular Biology, 17(12), 3542–3556. https://doi.org/10.1161/01.ATV.17.12.3542
Siri-Tarino, P. W., Sun, Q., Hu, F. B., & Krauss, R. M. (2010). Saturated fat, carbohydrate, and cardiovascular disease. American Journal of Clinical Nutrition, 91(3), 502–509. https://doi.org/10.3945/ajcn.2008.26285
Sniderman, A. D., Thanassoulis, G., Glavinovic, T., Navar, A. M., Pencina, M., Catapano, A., & Ference, B. A. (2019). Apolipoprotein B particles and cardiovascular disease: A narrative review. JAMA Cardiology, 4(12), 1287–1295. https://doi.org/10.1001/jamacardio.2019.3780
Sniderman, A. D., Williams, K., Contois, J. H., Monroe, H. M., McQueen, M. J., de Graaf, J., & Furberg, C. D. (2011). A meta-analysis of low-density lipoprotein cholesterol, non–high-density lipoprotein cholesterol, and apolipoprotein B as markers of cardiovascular risk. Circulation: Cardiovascular Quality and Outcomes, 4(3), 337–345. https://doi.org/10.1161/CIRCOUTCOMES.110.959247
St-Pierre, A. C., Ruel, I. L., Cantin, B., Dagenais, G. R., Bernard, P. M., Després, J. P., & Lamarche, B. (2001). Comparison of various electrophoretic characteristics of LDL particles and their relationship to the risk of ischemic heart disease. Circulation, 104(19), 2295–2299. https://doi.org/10.1161/hc4401.098485
Volek, J. S., Fernandez, M. L., Feinman, R. D., & Phinney, S. D. (2008). Dietary carbohydrate restriction induces a unique metabolic state positively affecting atherogenic dyslipidemia, fatty acid partitioning, and metabolic syndrome. Progress in Lipid Research, 47(5), 307–318. https://doi.org/10.1016/j.plipres.2008.03.001
Wolska, A., Mansourian, Y., Zubirán, R., et al. (2026). New methods for calculating LDL-cholesterol and related biomarkers of atherosclerotic cardiovascular disease risk. Current Atherosclerosis Reports, 28, Article 27. https://doi.org/10.1007/s11883-026-01398-z
Zubiran, R., Sampson, M., Wolska, A., & Remaley, A. T. (2025). Estimated small, dense LDL cholesterol and atherosclerotic cardiovascular risk in the UK Biobank. Arteriosclerosis, Thrombosis, and Vascular Biology, 45(10), e512–e522. https://doi.org/10.1161/ATVBAHA.125.323157